
Nuclear Magnetic Resonance (NMR) spectroscopy - PowerPoint PPT Presentation
Title: Nuclear Magnetic Resonance (NMR) spectroscopy
1
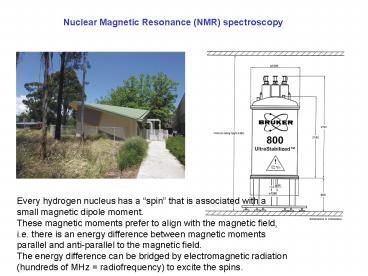
Nuclear Magnetic Resonance (NMR) spectroscopy
Every hydrogen nucleus has a spin that is
associated with a small magnetic dipole moment.
These magnetic moments prefer to align with the
magnetic field, i.e. there is an energy
difference between magnetic moments parallel and
anti-parallel to the magnetic field. The energy
difference can be bridged by electromagnetic
radiation (hundreds of MHz radiofrequency) to
excite the spins.
2
1H NMR spectrum of a small protein in water
All 1H spins in a protein yield signals in the 1H
NMR spectrum. Their frequencies differ slightly
(by a few parts per million ppm) depending on
the chemical environment. This is the chemical
shift. The signal from a particular hydrogen
atom in a protein can be used as a spy to
report on the chemical environment. There is a
lot of overlap between the signals from different
1H spins In the one-dimensional 1H NMR spectrum
of a protein.
3
Two-dimensional NMR spectra
Two-dimensional NMR spectra provide improved
resolution. In a NOESY spectrum, the peaks on the
diagonal (the diagonal-peaks) correspond to the
1D NMR spectrum. The peaks in the plane are
cross-peaks. Cross-peaks connect two
diagonal-peaks with different chemical
shifts. (Simply draw a vertical and a horizontal
line from each cross-peak to find the
corresponding diagonal-peaks.) In a NOESY
spectrum, cross-peaks arise when two 1H spins are
close in space (lt 5 A). Hundreds of cross-peaks
corresponds to hundreds of short contacts -gt this
can be used to calculate a 3D structure!!
NOESY spectrum
2D NMR spectrum
if each cross-peak can be assigned to a specific
1H spin pair, that is The assignment of the NMR
spectrum is readily achieved by a number of
different 2D and 3D NMR spectra not discussed
here.
4
Determination of 3D structures of proteins by NMR
spectroscopy
NOESY spectrum
3D structure
Each peak in the NOESY spectrum indicates a
proton-proton distance lt 5 A, representing a
distance restraint. Many hundred distance
restraints define the 3D structure of the
protein. Initially, only a few NOESY cross-peaks
can be assigned to individual proton pairs (the
rest is ambiguous, because of spectral overlap).
Once an initial structure has been calculated,
more NOEs can be assigned. This leads to a
refined structure, allowing the assignment of
further NOEs etc. This process has recently been
automated. In calculating the structure, one
assumes that only the dihedral angles around
rotatable bonds are unknown, i.e. standard
values of bond lengths and bond angles are used
to define the covalent geometry of the
polypeptide chain.
5
The final protein structure is represented by a
bundle of conformers that all fulfill the
experimental restraints
The structure is well-known in those regions,
where the bundle of conformers is very tight.
The structure is less well defined where the
individual conformers are more different (see,
e.g., near the N-terminus, marked N). Often,
less well-defined regions of the protein are also
more mobile than the well-defined regions (see,
e.g., amino acid side chains compared to the
backbone of the protein). As an indicator of the
precision of the structure determination, NMR
spectroscopists report the root mean square
deviation (rmsd) between the coordinates of the
different conformers and the mean structure
(which simply is the average of the coordinates
of corresponding atoms in the different
conformers). An NMR structure with an rmsd of 0.5
Å can be compared to a crystal structure of 2 Å
resolution.
6
3D and 4D NMR
Three- and four-dimensional NMR spectra can be
recorded. They provide improved spectral
resolution. Example 3D HNCO spectrum correlates
the chemical shifts of HN, N and CO in a protein
7
How big a protein can be studied by NMR?
higher molecular weight broader NMR
signals Therefore, proteins gt 30 kDa are hard
work.
protein
9 kDa
protein-DNA complex
19 kDa
DNA
10 kDa
(the right half of the spectrum was scaled down)
8
Improved spectral resolution by uniform isotope
labelling with 15N and 13C
Natural stable isotopes
99.9 1H (spin 1/2) 0.015 2H (spin 3/2, very
broad signals, usually invisible in the NMR
spectrum) 99 12C (no magnetic moment) 1 13C
(spin 1/2) 99.7 14N (spin 1, very broad
signals, usually invisible in the NMR
spectrum) 0.3 15N (spin 1/2)
This means At natural isotopic abundance, 1H NMR
spectra can always easily be obtained. 12C and
(in practice) 14N are NMR invisible. 13C and 15N
NMR spectra can be recorded, but are much less
sensitive. 3D and 4D NMR spectra require
proteins that are uniformly enriched with 13C and
15N. This is easy to achieve by expression in E.
coli using commercial 15N/13C/2H media. Note
13C, 15N and 2H are naturally occurring, stable
isotopes no radioactivity!
9
I want to determine the 3D structure of a protein
by NMR what do I need?
- Concentration at least 0.5 ml of a 0.1-0.5 mM
protein solution - pH lt 7.5 (otherwise many of the amide protons
exchange too rapidly with water protons to be
observable) - Molecular weight lt 40 kDa
- (The total molecular weight of the system
counts, i.e. a dimer is two times heavier than a
monomer and - in the case of a membrane protein all the
molecules from the membrane or micelle must be
counted too.) - 4) Isotope labelling not needed if lt 12 kDa, 15N
labelling if lt 15 kDa, 15N/13C labelling if lt 30
kDa, - 15N/13C/2H labelling if gt 30 kDa
The point of deuterium labelling The magnetic
dipole moment of 2H is about seven times smaller
than the magnetic dipole moment of 1H. If all CH,
CH2, CH3 groups are replaced by CD, CD2, CD3
groups, the remaining NH groups are in an
environment with a much more homogeneous
magnetic field. This results in much narrower 1H
NMR signals. The NMR spectra of NH groups can be
assigned for 100 kDa proteins with 15N/13C/2H
labelling!
10
15N-HSQC spectrum
- cross-peaks correlate the chemical shifts of the
hydrogens -
with the directly bonded nitrogens - - one cross-peak for each NH group
- no diagonal peaks
100
110
15N
(ppm)
120
130
This spectrum was recorded with a 15N-labelled
protein of 187 amino acid residues.
8
7
6
9
11
10
1H (ppm)
15N-HSQC spectra are great, because they yield
only one peak per amino acid residue good
spectral resolution!
11
Amino-acid selective labelling of proteins
Why The assignment of 15N-HSQC cross-peaks to
individual amino-acid residues takes time, if
the protein is uniformly labelled with 15N.
With selective 15N/13C labelling, individual
cross-peaks can be assigned very
quickly. How Express protein with a mixture of
amino acids, only one or two of them isotope
labelled. Example PpiB is an enzyme in E. coli
which isomerizes peptide bonds involving proline.
The amino acid sequence is shown below, the
15N-HSQC spectrum of the uniformly labelled
protein at the left. Labelling with 15N-arginine
(commercial compound) results in a 15N-HSQC
spectrum with only 5 cross-peaks.
E. coli prolyl cis-trans isomerase (PpiB)
12
NMR in pharmaceutical research
15N-HSQC spectrum (only arginines 15N-labelled)
Only the cross-peak from Arg87 changes its
chemical shift in the presence of the small
molecule. Therefore, this molecule binds near
Arg87.
15N-HSQC spectrum small
molecule (signals from the small molecule circled)
Arg87
- This shows
- binding of the small molecule
- identification of binding site
FEBS Lett. 524, 159 (2002)
13
Assignment of the 15N-HSQC cross-peak of Arg87 by
double-selective labelling
15N-HSQC spectrum of protein with 15N-labelled
arginines.
HNCO spectrum of protein with 15N-labelled
arginines and 13C-labelled alanines.
Arg87 is the only arginine preceded by
alanine. The HNCO spectrum shows cross-peaks only
for those HN-groups that are immediately preded
by 13C carbonyl groups.
14
15N-HSQC spectrum of an unfolded protein
2 spectra are superimposed black cross-peaks
protein A (15N-labelled) in the absence of
protein C red cross-peaks protein A
(15N-labelled ) in the presence of protein C
(unlabelled)
The narrow distribution of 1H chemical shifts in
the free protein (black cross-peaks) indicates
random coil conformation (all amide protons
have a very similar chemical environment, i.e.
water). The much wider distribution of 1H
chemical shifts in the complex (red cross-peaks)
is characteristic of a folded protein. A
corresponding pair of spectra was obtained for
15N-labelled protein C in the absence and
presence of unlabelled protein A.
Nature 415, 549 (2002)
15
Hydrogen exchange
Hydrogen exchange measurements lyophilize
protein and dissolve in D2O. H-bonded and buried
amide protons exchange with deuterium from
D2O more slowly than solvent-exposed amide
protons.
16
Application hydrogen exchange as structure
indicator
The prion protein pecipitates into insoluble
fibrils. An electron microscopy picture is shown
here
The regions of slow hydrogen exchange (blue
arrows below amino acid sequence) are in
agreement with four b-strands
Hydrogen exchange measurements 1) incubate the
precipitate with D2O, 2) dissolve aliquotes at
different times in DMSO with 0.1 TFA, 3) measure
residual peak intensities in 15N-HSQC spectrum.
Nature 435, 844 (2005)
17
Application H-D exchange for detection of
protein-protein interaction surfaces
red spheres amides with reduced H-exchange rates
in complex blue sphere amide with enhanced
H-exchange rate in the complex gray spheres no
difference between free and complexed protein
red spheres interacting residues as shown by
site-directed mutagenesis
Prot. Sci., 12, 811 (2003)
18
Screening of chemical compound libraries by NMR
All pharmaceutical companies use NMR spectroscopy
to identify chemical compounds that bind to
protein targets as a step in drug
development! Example The NMR spectrum of a
cocktail of compounds is recorded in the absence
of the target protein (a) and in its presence
(b). The protein signals are not observable,
because the molecular weight of the protein is
very high, resulting in extremely broad NMR
signals that are indistinguishable from the
baseline. The difference between spectrum (a) and
(b) is shown in (c). It displays only three
peaks (apart from the solvent signal in the
centre). These three peaks belong to the compound
the NMR spectrum of which is shown in (d). This
compound obviously binds to the protein its
signals become as broad as those of the protein
when it is bound and therefore disappear from
the NMR spectrum in (b). If none of the
compounds present in the cocktail binds to the
protein, the difference between (a) and (b) is
empty (example shown in (e)).
19
MR imaging
20
The human body consists to 50-60 of water (75
in brain). The NMR signal of the water and its
properties (local concentration, relaxation rate
of its magnetization, migration during the
imaging experiment) is detected. The spatial
distribution is obtained by applying magnetic
field gradients. The frequency of the NMR signal
of water is proportional to the strength of the
magnetic field. Therefore, a magnetic filed
gradient separates the water signals from
different parts of the body.
21
Structural image
Functional imaging
Functional imaging records the difference in the
brain image when a part of the brain is active
versus non-active. Active areas of the brain are
characterized by increased blood-flow. The result
is usually plotted on top of a structural image
Angiography