
Pedestrian Scenario Design and Performance Assessment in Driving Simulations - PowerPoint PPT Presentation
1 / 27
Title:
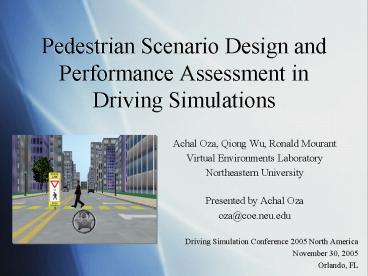
Pedestrian Scenario Design and Performance Assessment in Driving Simulations
Description:
Pedestrian Scenario Design and Performance Assessment in ... Alienware computer. Pentium 4 3.4 GHz. GeForce 6800 Ultra. Parabolic screen. 1024 x 768 resolution ... – PowerPoint PPT presentation
Number of Views:55
Avg rating:3.0/5.0
Title: Pedestrian Scenario Design and Performance Assessment in Driving Simulations
1
Pedestrian Scenario Design and Performance
Assessment in Driving Simulations
- Achal Oza, Qiong Wu, Ronald Mourant
- Virtual Environments Laboratory
- Northeastern University
- Presented by Achal Oza
- oza_at_coe.neu.edu
- Driving Simulation Conference 2005 North America
- November 30, 2005
- Orlando, FL
2
Overview
- Motivation
- Technology
- Triggering System
- Scenarios and Results
- Analysis
3
Motivation
- 4,749 pedestrians were killed in motor vehicle
accidents in 2003 - Improve safety by developing scenarios that may
be unsafe or impossible to test in a real-world
environment - Test subjects for situation awareness, hazard
detection, and decision-making
4
Overview
- Motivation
- Technology
- Triggering System
- Scenarios and Results
- Analysis
5
Technology
- 91 Dodge Caravan
- Force feedback steering wheel and pedals
- Alienware computerPentium 4 3.4 GHzGeForce 6800
Ultra - Parabolic screen
- 1024 x 768 resolution30 horizontal field of view
6
Overview
- Motivation
- Technology
- Triggering System
- Scenarios and Results
- Analysis
7
Pedestrian Model
- MD2 file format (originally developed for Quake
2) - Two types of animations
- Walking
- Idling
8
Triggering System
- An objects action is triggered by another object
performing a specified action - Pedestrians use two type of triggers
- Traffic lights
- User vehicle
9
Triggering SystemTraffic Light Triggers
- The pedestrian is bound to a traffic light
- Walking is triggered by a green light
- Continues walking even after light change back to
red
10
Triggering SystemUser Vehicle
- Pedestrian is bound to the user vehicle
- Walking is triggered when the vehicle enters a
specified radius
11
Overview
- Motivation
- Technology
- Triggering System
- Scenarios and Results
- Crosswalk Scenario
- Intersection Dash Scenario
- Vehicle Turning Scenario
- Bus Stop Scenario
- Analysis
12
Crosswalk Scenario
- Crosswalk with a yield-to-pedestrians sign
- Crossing starts when driver is 225 feet away
- High pedestrian visibility
13
Results for Crosswalk Scenario
- 8 out of 10 subjects avoided a collision
- Stopped near crosswalk
- Good Time-To-Collision estimate
- The remaining two slowed down after collision
14
Overview
- Motivation
- Technology
- Triggering System
- Scenarios and Results
- Crosswalk Scenario
- Intersection Dash Scenario
- Vehicle Turning Scenario
- Bus Stop Scenario
- Analysis
15
Intersection Dash Scenario
- Driver waits at an intersection for a red light
to turn green - Pedestrian illegally crosses after the driver
enters the intersection
16
Results for Intersection Dash Scenario
- 6 out of 10 subjects avoided a collision
- The remaining four ran through the red light
17
Overview
- Motivation
- Technology
- Triggering System
- Scenarios and Results
- Crosswalk Scenario
- Intersection Dash Scenario
- Vehicle Turning Scenario
- Bus Stop Scenario
- Analysis
18
Vehicle Turning Scenario
- Pedestrian crosses in front of the user vehicle
while making a left turn at an intersection - High pedestrian visibility
19
Results for Vehicle Turning Scenario
- 6 out of 10 subjects stopped before reaching the
pedestrian - Remaining four slowed down, without completely
stopping, allowing the pedestrian to safely cross
20
Overview
- Motivation
- Technology
- Triggering System
- Scenarios and Results
- Crosswalk Scenario
- Intersection Dash Scenario
- Vehicle Turning Scenario
- Bus Stop Scenario
- Analysis
21
Bus Stop Scenario
- Initially obstructed from view by a bus
- Jaywalker enters street when driver is within 130
feet - Minimal pedestrian visibility
22
Results for Bus Stop Scenario
- 10 out of 10 subjects collided with the
pedestrian - 4 out of 10 stopped after the collision
23
Overview
- Motivation
- Technology
- Triggering System
- Scenarios and Results
- Analysis
24
Scenario Analysis
- Scenarios ranked from safe to dangerous
- Crosswalk
- Vehicle Turning
- Intersection Dash
- Bus Stop
- Safety increases when visibility increases
25
Future Study
- Focus on varying pedestrian visibility
- Larger sample sizes and more test groups
- Experienced and inexperienced drivers
- Add intelligence to the pedestrians
- Hesitate when crossing in a dangerous area
- Collect real-world data for validation (where
possible) - Use a variety of pedestrian models
- Children, the elderly, etc.
26
References
- 1. NHTSA, (2004). Traffic Safety Facts
2003-National Highway Traffic Safety
Administration - 2. Kenneth R. Laughery, Theodore E. Anderson
Edwin A. Kidd (1967). A computer simulation
model of driver-vehicle performance at
intersection. Proceeding of the 1967 22nd
national conference. ACM Press. New York, NY,
USA. - 3. Dirk Helbing. (1992) Model for Pedestrian
Behavior. Pages 93-98 in Natural Structures.
Principles, Strategies, and Model in Architecture
and Nature, Part II. - 4. Staplin, L., K. Lococo, and S. Byington.
Older Driver Highway Design Handbook. The
Scientex Corporation Transportation Safety
Division, Pennsylvania 19443, FHWA-RD-97-135,
January 1998. - 5. Gale, A.G., et al. Time-To-Collision As A Cue
For Decision-Making in Braking. Vision in
Vehicles. Vol. 3, 1991, pp. 19-26. - 6. Hoffman, Errol R., and Rudolf G. Mortimer.
Drivers Estimates Of Time To Collision. Accid
Anal Prev, Vol. 26, No. 4, 1994, pp. 511-520.
27
Questions?
- Achal Oza
- oza_at_coe.neu.edu
- Virtual Environments Laboratory
- Northeastern University
Recommended
CrystalGraphics Presentations


