
Global Tectonics - PowerPoint PPT Presentation
1 / 45
Title: Global Tectonics
1
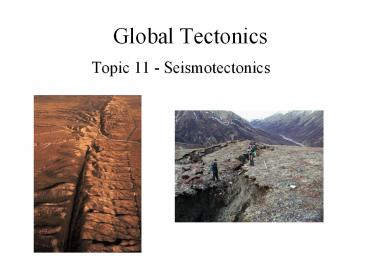
Global Tectonics
- Topic 11 - Seismotectonics
2
P WAVE FIRST MOTIONS
Polarity of first P-wave arrival varies between
seismic stations in different directions. First
motion is compression for stations located such
that material near the fault moves toward'' the
station, or dilatation, where motion is away
from'' the station. When a P wave arrives at a
seismometer from below, a vertical
component seismogram records up or down first
motion, corresponding to either compression or
dilatation.
3
P WAVE FIRST MOTIONS
First motions define four quadrants two
compressional and two dilatational. Quadrants
separated by nodal planes the fault plane and
auxiliary plane perpendicular to it. From the
nodal planes fault geometry is known. Because
motions from slip on the actual fault plane and
from slip on the auxiliary plane would be the
same, first motions alone cannot resolve which is
the actual fault plane.
4
(No Transcript)
5
Beachballs earthquake focal mechanisms
6
(No Transcript)
7
Andersons fault theory
8
(No Transcript)
9
Oceanic transforms seismic test of plate
tectonics
10
(No Transcript)
11
(No Transcript)
12
(No Transcript)
13
(No Transcript)
14
(No Transcript)
15
(No Transcript)
16
Global distribution of the earthquake epicenters
17
Global distribution of the earthquake
focal mechanisms
18
WORLD STRESS MAP Combines earthquake
mechanisms other stress indicators
ALPINE CONVERGENCE
DINARIDES COMPRESSION
HELLENIC ARC EXTENSION
APPENNINE EXTENSION
NUBIA-EURASIA CONVERGENCE COMPRESSION
DEAD SEA TRANSFORM SINAI-ARABIA STRIKE SLIP
19
US stress map
20
How do we measure the earthquake size?
- Intensity based on damage
21
How do we measure the earthquake size?
- Intensity based on damage
- Magnitude M log(amplitude) aD b
22
(No Transcript)
23
How do we measure the earthquake size?
- Intensity based on damage
- Magnitude M log(amplitude) aD b
24
How do we measure the earthquake size?
- Intensity based on damage
- Magnitude M log(amplitude) aD b
- Moment Mo shear modulus X rupture area X
offset
25
How do we measure the earthquake size?
- Intensity based on damage
- Magnitude M log(amplitude) aD b
- Moment Mo shear modulus X rupture area X
offset - Energy log (E) 1.5 M 5.2
26
1906 SAN FRANCISCO EARTHQUAKE Ms 7.8 4 m
strike-slip on 450 km of San Andreas 2500
deaths, 28,000 buildings destroyed (most by
fire) Catalyzed ideas about relation of
earthquakes surface faults
Boore, 1977
27
TRENCH-NORMAL CONVERGENCE - ALEUTIAN TRENCH 54
mm/yr
1964 ALASKA EARTHQUAKE Ms 8.4 Mw
9.1 Pacific subduction beneath North America
7 m of slip on 500x300 km2 of Aleutian
Trench Second largest earthquake recorded to
date 130 deaths Catalyzed idea that great
thrust fault earthquakes result from slip on
subduction zone plate interface
NORTH AMERICA
PACIFIC
28
1971 Ms 6.6 SAN FERNANDO EARTHQUAKE 1.4 m slip on
20x14 km2 fault Thrust faulting from compression
across Los Angeles Basin Fault had not been
previously recognized 65 deaths, in part due to
structural failure Prompted improvements in
building code hazard mapping
29
COMPARE EARTHQUAKES USING SEISMIC MOMENT M0
Magnitudes, moments (dyn-cm), fault areas, and
fault slips for several earthquakes Alaska San
Francisco differ much more than Ms implies M0
more useful measure Units dyne-cm or
Nt-M Directly tied to fault physics
30
Moment magnitude Mw Magnitudes saturate No
matter how big the earthquake mb never exceeds
6.4 Ms never exceeds 8.4 Mw defined from moment
so never saturates
31
Earthquakes of a given magnitude are 10 times
less frequent than those one magnitude smaller.
An M7 earthquake occurs approximately monthly,
and an earthquake of Mgt 6 about every three days.
Hence although earthquake predictor I. Browning
claimed to have predicted the 1989 Loma Prieta
earthquake, he said that near a date there would
be an M6 earthquake somewhere, a prediction
virtually guaranteed to be true. Magnitude is
proportional to the logarithm of the energy
released, so most energy released seismically is
in the largest earthquakes. An M 8.5 event
releases more energy than all other earthquakes
in a year combined. Hence the hazard from
earthquakes is due primarily to large (typically
magnitude gt 6.5) earthquakes.
32
Where is most of seismic energy released?
33
(No Transcript)
34
Elastic rebound theory
35
Reid, 1910
36
(No Transcript)
37
(No Transcript)
38
(No Transcript)
39
(No Transcript)
40
San Francisco Earthquake
April 18, 1906 512 am Magnitude 8.3
430 km rupture
6 meters of slip
41
(No Transcript)
42
(No Transcript)
43
Fialko, Nature 2006
Line of sight velocities from stacked
InSAR data 35 interferograms Epoch 1992-2000
Southern SAF
44
Fialko, Nature 2006
Line of sight velocities from stacked
InSAR data 35 interferograms Epoch 1992-2000
Southern SAF
45
Coseismic stress changes
Recommended
CrystalGraphics Presentations


