
Analysis of Rainfall Data - PowerPoint PPT Presentation
1 / 12
Title: Analysis of Rainfall Data
1
Analysis of Rainfall Data
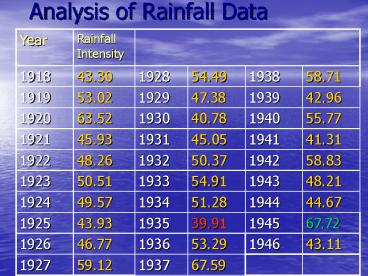
Year Rainfall Intensity
1918 43.30 1928 54.49 1938 58.71
1919 53.02 1929 47.38 1939 42.96
1920 63.52 1930 40.78 1940 55.77
1921 45.93 1931 45.05 1941 41.31
1922 48.26 1932 50.37 1942 58.83
1923 50.51 1933 54.91 1943 48.21
1924 49.57 1934 51.28 1944 44.67
1925 43.93 1935 39.91 1945 67.72
1926 46.77 1936 53.29 1946 43.11
1927 59.12 1937 67.59
2
- Sample mean
- Sample variance S2
- Approximately, 68 within 50.7 /- 1 x 7.71 or
43.0 to 58.4 - Approximately, 95 within 50.7 /- 2 x 7.71 or
35.3 to 66.1
50.7
59.4
S 7.71
3
Construction of Histogram
- Rearrange data in increasing order
- Note the range and divide into suitable intervals
(say at 4 inches in this example) - Count number of occurrence in each interval
- Plot Histogram
4
HISTOGRAM
Total Area 116
FREQUENCY DIAGRAM
3/116 0.026 or 2.6
Total Area 1.0
5
Frequency Diagram
- Determine total area of histogram, say A
- Modify the vertical scale of histogram by
dividing the value by A, - For the rainfall example, A 116, ordinate of
first strip 3/116 0.026 or 2.6
6
FREQUENCY DIAGRAM
Model
Area 0.152
7
Statistics of Sustained Live Load
- Floor Load Intensity (lb/ft2) National Bureau
of Standard Report 1952
8
Data on First Floor, Bay Size 400ft2
7.8 72.6 42.5 55.9 26.0 66.4
73.4 106.5 30.2 37.0 24.1 23.4
49.8 106.9 48.4 55.0 54.8 65.7
62.5 68.7 118.2 55.6
Xj, j 1,2,3.N
N 22
P(L.L.gt56.88 lb/ft2) ?
9/22
9
Histogram
- Select interval, ?X (e.g. ?X25 lb/ft2)
- Count no. observations within each interval
according to - a lt Xj b say ni
10
Histogram
- 3. Plot the results
11
Scattergram
12
(No Transcript)
Recommended
CrystalGraphics Presentations


