
MODIS Specifications and Atmosphere products - PowerPoint PPT Presentation
1 / 52
Title: MODIS Specifications and Atmosphere products
1
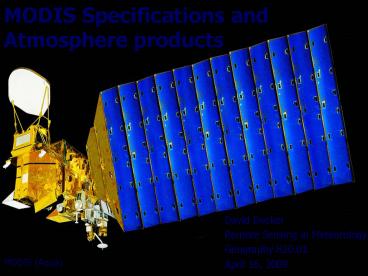
MODIS Specifications and Atmosphere products
- David Decker
- Remote Sensing in Meteorology
- Geography 820.01
- April 16, 2009
MODIS (Aqua)
2
Definitions
- Spectral Resolution - a measurement of the
radiation reflected and/or emitted by features - Spatial Resolution - a measurement of the
smallest angular or linear separation between two
objects that can be resolved by a remote sensing
system. - Temporal Resolution - refers to how often the
sensor records imagery of a particular area. - Radiometric Resolution - the sensitivity of a
remote sensing detector to differences in signal
strength as it records the radiant flux
reflected, emitted, or backscattered from the
terrain. (Ex. 6 bit data or values 0-255 or 26)
3
Definitions
(Sabins, 1987)
4
MODIS Specifications
- Orbit 705 km, 1030 a.m. descending node
(Terra) or 130 p.m. ascending node (Aqua),
sun-synchronous, near-polar, circular - Scan Rate 20.3 rpm, cross-track scanner
- Swath Dimensions 2330 km (cross track) by 10 km
(along track at nadir) - Spatial Resolution 250 m (bands 1-2)
500 m (bands 3-7)
1000 m (bands 8-36) - Design Life 6 years
5
Primary Use and Band Number
- Land/Cloud/Aerosols boundaries Bands 1-2
- Land/Cloud/Aerosols properties Bands 3-7
- Ocean color/Phytoplankton/Biogeochemistry Bands
8-16 - Atmospheric Water Vapor Bands 17-19
- Surface/Cloud Temperature Bands 20-23
- Atmospheric Temperature Bands 24-25
- Cirrus Clouds/ Water Vapor Bands 26-28
- Cloud Properties Band 29
- Ozone (O3 ) Band 30
- Surface/Cloud Temperature (Thermal) Bands 31-32
- Cloud Top Altitude Bands 33-36
6
Terra Orbit Track
Courtesy of SSEC Univ. Wisconsin
7
Aqua Orbit Track
Courtesy of SSEC Univ. Wisconsin
8
Cloud and Aerosol Properties, Precipitable water,
and Profiles of Temperature and Water Vapor from
MODIS (Michel D. King, 2006)
- MODIS atmospheric products (Level 3)
- - Contents and changes in Collection 5
- - Zonal and Time Series data of
atmospheric products - Methodology
- - 1 x 1 equal angle grid (1 km
spatial resolution) - Statistics
- - Mean, standard deviation, minimum,
maximum - - Quality Assurance (QA) mean
- - Cloud fraction, pixel counts
- - Joint probability density functions
- - Joint histograms between various cloud
properties - (e.g., cloud optical thickness vs.
cloud top pressure)
9
Monthly Mean Cloud Fraction(S. A. Ackerman, R.
A. Frey et al. Univ. Wisconsin)
Aqua April 2005 (Collection 5)
10
Zonal Mean Cloud Fraction(S. A. Ackerman, R. A.
Frey et al. Univ. Wisconsin)
April 2005
Aqua
11
Time Series of Cloud Fraction at Daytime(M. D.
King, S. Platnick et al. NASA GSFC)
July 2002 July 2004
12
Monthly Mean Cloud Top Properties (W.P. Menzel,
R. A. Frey et al. NOAA, Univ. Wisconsin)
Aqua April 2005 (Collection 5)
13
Zonal Mean Cloud Top Properties (W.P. Menzel, R.
A. Frey et al. NOAA, Univ. Wisconsin)
Aqua
April 2005
14
Monthly Mean Cloud Optical Thickness(M. D. King,
S. Platnick et al. NASA GSFC)
Aqua (QA mean) April 2005 (Collection 5)
15
Monthly Mean Cloud Effective Radius(M. D. King,
S. Platnick et al. NASA GSFC)
Aqua (QA mean) April 2005 (Collection 5)
16
Zonal Mean Cloud Effective Radius(M. D. King, S.
Platnick et al. NASA GSFC)
April 2005
Aqua
17
Cloud Effective Radius Uncertainties(S.
Platnick, R. Pincus, et al. NASA GSFC, NOAA CDC)
Liquid Water Cloud (Collection 5)
Daily Aggregation (corr. Between pixels 1)
Monthly Aggregation (daily uncertainties
uncorrelated)
18
Multilayer Cloud Flag(S. Platnick, M. D. King et
al. NASA GSFC)
Aqua April 2005 (Collection 5)
19
Monthly Mean Aerosol Optical Properties (L.A.
Remer, Y. J. Kaufman, and D. Torré et al. GSFC,
Univ. Lille)
Aqua April 2005 (Collection 5)
20
Zonal Mean Aerosol Optical Properties (L.A.
Remer, Y. J. Kaufman, and D. Torré et al. GSFC,
Univ. Lille)
April 2005
Aqua
21
Monthly Mean Precipitable Water (B. C. Gao, S.
W. Seeman, J. Li, W. P. Menzel NRL, Univ.
Wisconsin)
Aqua April 2005 (Collection 5)
Daytime Land Sunlight (1 km pixels)
Day Night (5 km pixels)
22
Monthly Mean Water Vapor (S. W. Seeman, J. Li,
W. P. Menzel Univ. Wisconsin, NOAA)
Aqua April 2005 (Collection 5)
23
Monthly Mean Water Vapor (S. W. Seeman, J. Li,
W. P. Menzel Univ. Wisconsin, NOAA)
Aqua April 2005 (Collection 5)
24
Monthly Mean Water Vapor (S. W. Seeman, J. Li,
W. P. Menzel Univ. Wisconsin, NOAA)
Aqua April 2005 (Collection 5)
25
MODIS Atmosphere Applications (Level 3)
- Monthly joint histogram counts of liquid water
clouds over the ocean off of the south California
coastline. - Deep Blue Algorithm for SeaWifs MODIS
26
California/ California Current Regime32-40N,
117-125WJune 2005
Aqua/MODIS (PM Overpass)
Terra/MODIS (AM Overpass)
50
50
40
40
30
30
Cloud Optical Thickness
20
20
15
15
10
10
8
8
6
4
6
4
2
0
2
20
15
30
17.5
12.5
10
6
4
0
25
2
8
17.5
12.5
8
2
10
25
20
15
6
4
30
Cloud Effective Radius (µm)
Cloud Effective Radius (µm)
27
Deep Blue Algorithm for SeaWifs MODIS(N. C.
Hsu, S. C. Tsay, M. D. King, and J. R. Herman
NASA GSFC)
- Utilize solar reflectance at ? 412, 490, and
670 nm to retrieve aerosol optical thickness (ta)
and single scattering albedo (?o) - Compared to Ultra violet methods, this algorithm
is less sensitive to aerosol height - Can retrieve aerosol properties over various
types of surfaces such as a very bright desert
(i. e. Middle East)
28
Aerosol Optical Thickness of Dust Plumes in
Africa (N. C. Hsu, S. C. Tsay, M. D. King, and
J. R. Herman NASA GSFC)
SeaWifs
Cloud
Cloud
Hsu et al. (2004)
29
MODIS Deep Blue Algorithm over the Middle
East(N. C. Hsu, S. C. Tsay, M. D. King NASA
GSFC)
Aerosol Optical Thickness
True Color Composite (0.65, 0.56, 0.47)
August 7, 2005
2.5
2.0
1.5
1.0
0.5
0.0
Aerosol Optical Thickness
30
DiscussionMODIS atmosphere productsMichael D.
King Presentation (2006)
- Difficult to follow along and to summarize a
presentation not knowing presenters original
thoughts. - - Showed sample of cloud fraction, cloud top
properties, cloud optical and microphysical
properties, aerosol properties, water vapor,
temperature profiles, and zonal cross sections of
April 2005. - - Are there any periods throughout the year
where these products perform better or worse than
April? - - Did not explain the methods on how they
produced these products other than they come from
MOD43B3. - Highlights applications from MODIS Aqua. Some
Terra imagery applied.
31
Spatially Complete Global Surface Albedos Derived
from Terra/MODIS Data (King et al. 2006)
Conditioned Albedo Maps by Season
- Operational MODIS surface albedo data product
(MOD43B3) - - 1 km spatial resolution
- - 16-day periodicity
- Motivation
- - MOD43B3 can be applied to Land Surface and
climate modeling and Global change research
32
IGBP Ecosystem Classification (MOD12Q1)
6 Closed Shrubs (0.63)
0 Water
12 Croplands (10.09)
13 Urban and Built-Up (0.17)
1 Evergreen Needleleaf Forest
7 Open Shrubs (18.86)
2 Evergreen Broadleaf Forest
8 Woody Savannas (6.32)
14 Cropland/Natural Veg. Mosaic
9 Savannas (6.63)
15 Snow and Ice (11.31)
3 Deciduous Needleleaf Forest
10 Grasslands (7.30)
16 Barren or Sparsely Vegetated (13.00)
4 Deciduous Broadleaf Forest
11 Permanent Wetlands (0.33)
5 Mixed Forests (4.85)
33
General Methodology
- Compute regional ecosystem statistics
- -0.5, 1-5, 10 box sizes
- Obtain pixel-level and regional ecosystem
statistical phenological trends - - Curves have different magnitudes and shapes
are consistant - Impose shape of curves onto pixel level data
- Select the best representative curve
- Fill in missing values with selected curve
34
Example Phenological Curves for Deciduous
Broadleaf ForestVermont, USA
Phenological Curves
Phenological Curves w/ Offset Applied
35
Continental United StatesJuly 12-27, 2002
36
Seasonal Snow Methodology
- Cloud and snow cover obscure full decay state
- Over hemisphere average of high latitudes
- - Unique ecosystem and wavelength extrema
change - - Compute change from pixels with adequate
representation - For each pixel/statistical curve
- - pin winter endpoints with value computed
from change and summer extrema - Then apply General Methodology
37
Persistent Cloud Methodology
- Clouds obscure trends over large regions (e.g.
Asian Monsoon) - - full growth stage is usually obscured
- - 10 x 30 boxes may not observe complete
temporal trend - Compute 1 statistical curve per ecosystem class
- - 5-15 Latitude belts
- - Yearly phenological curves
- Impose shape of curve onto existing pixel data
38
Indian Subcontinent during MonsoonJune 10-26,
2002
39
Africa in the Presence of Persistent
CloudsDecember 3-18, 2002
40
Spatially Complete Albedo Maps
41
Spectral Variability by Ecosystem ClassJune 26
July 11, 2001
VIS
VIS
42
Spectral Albedo of Snow
- Used near real-time ice and snow extent (NISE)
dataset - - This distinguishes land snow and sea ice
(away from coastal regions) - - Identifies snow
- - Projected onto an equal angle 1 grid
- Aggregate snow albedo from MOD43B3 product
- - Surface albedo flagged as snow
- - Composite NISE snow type gt90 and
flagged as snow in any 16-day period - - Hemispherical multiyear statistics
- - Separate spectral albedo by ecosystem
(MOD12Q1) - Results represent average snow conditions
43
Spatially Complete White-Sky AlbedoJanuary 1-16,
2002
Snow-free
0.8
0.6
Surface Albedo (0.86 µm)
0.4
Snow-covered
0.2
0.0
44
Snow Albedo by IGBP Ecosystem ClassificationNorth
ern Hemisphere Multi-year average (2000-2004)
45
Summary and Conclusions
- Spatially complete surface albedo datasets have
been generated - - Uses high-quality operational MODIS dataset
- - White- and black- sky albedos produced for 7
spectral bands and 3 broadbands (e.g. 0.3 -
5.0,0.7-5.0, 0.3-0.7 microns) - Spectral Albedo of snow
- - Hemispheric averages of MOD43B3 validated
data - - Separated by ecosystem class and NISE
classification - - Addition variability due to snow depth, age,
grain size, and contamination not accessible from
MODIS data alone, and hence not incorporated
here.
46
DiscussionSpatially Complete Global Surface
Albedos derived from Terra/MODIS dataKing et
al. (2006) Presentation
- Step-by-step walk-through of his work.
- Good use of statistical analysis.
- Methodologies understood.
47
(No Transcript)
48
(No Transcript)
49
(No Transcript)
50
500 hPa
700 hPa
51
850 hPa
1000 hPa
52
(No Transcript)