
Bayesian Estimation of Confidence Intervals for NAACCR Predicted Age-adjusted Incidence Rates - PowerPoint PPT Presentation
1 / 1
Title:
Bayesian Estimation of Confidence Intervals for NAACCR Predicted Age-adjusted Incidence Rates
Description:
M.J. King, Missouri Department of Health and Senior Services ... by the state's age-adjusted mortality rates to provide a point estimate ... – PowerPoint PPT presentation
Number of Views:48
Avg rating:3.0/5.0
Title: Bayesian Estimation of Confidence Intervals for NAACCR Predicted Age-adjusted Incidence Rates
1
Bayesian Estimation of Confidence Intervals for
NAACCR Predicted Age-adjusted Incidence
Rates Gentry White, J. Jackson-Thompson, Missouri
Cancer Registry, University of Missouri-Columbia
M.J. King, Missouri Department of Health and
Senior Services
Abstract The NAACCR methodology for estimating
gender-race-site specific expected age-adjusted
incidence rates defines completeness in terms of
how close the observed estimate based on the
registry data is to the point estimate produced
by the NAACCR methodology. While this provides an
accepted and easily understood method for
estimating the expected age-adjusted rates, it
does not take into account the uncertainty
associated with the constituent (i.e., both
age-specific and age-adjusted) rate estimates.
The NAACCR methodology uses the ratio of the
age-adjusted SEER incidence rates and the
age-adjusted U.S. mortality rates multiplied by
the states age-adjusted mortality rates to
provide a point estimate of the desired
age-adjusted incidence rate. Using Bayesian
methodology to estimate the probability
distributions of NAACCR incidence rates, the
resulting empirical distribution can be used to
calculate prediction intervals and test
hypotheses concerning the expected rate.
Considering the variability inherent in these
point estimates, the results of the NAACCR method
for assessing completeness can be shown in some
cases to be ambiguous.
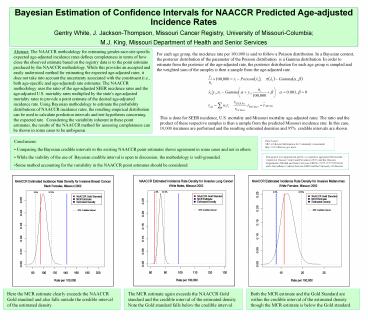
For each age group, the incidence rate per
100,000 is said to follow a Poisson distribution.
In a Bayesian context, the posterior distribution
of the parameter of the Poisson distribution is
a Gamma distribution. In order to estimate from
the posterior of the age-adjusted rate, the
posterior distribution for each age group is
sampled and the weighted sum of the samples is
then a sample from the age-adjusted rate.
This is done for SEER incidence, U.S. mortality
and Missouri mortality age-adjusted rates. The
ratio and the product of these respective samples
is then a sample from the predicted Missouri
incidence rate. In this case, 10,000 iterations
are performed and the resulting estimated
densities and 95 credible intervals are shown.
- Conclusions
- Comparing the Bayesian credible intervals to the
existing NAACCR point estimates shows agreement
in some cases and not in others. - While the viability of the use of Bayesian
credible interval is open to discussion, the
methodology is well-grounded. - Some method accounting for the variability in the
NAACCR point estimates should be considered.
Data Source MICA (Missouri Information for
Community Assessment) http//www.dhss.mo.gov/mica
/
This project was supported in part by a
cooperative agreement between the Centers for
Disease Control and Prevention (CDC) and the
Missouri Department of Health and Senior Services
(DHSS) (U55/CCU721904-04) and a Surveillance
Contract between DHSS and the University of
Missouri.
Here the MCR estimate clearly exceeds the
NAACCR Gold standard and also falls outside the
credible interval of the estimated density.
The MCR estimate again exceeds the NAACCR Gold
standard and the credible interval of the
estimated density Note the Gold standard falls
below the credible interval.
Both the MCR estimate and the Gold Standard are
within the credible interval of the estimated
density though the MCR estimate is below the Gold
standard.
Recommended
CrystalGraphics Presentations


