
Chemical Mass Balance Receptor Modelling - PowerPoint PPT Presentation
1 / 21
Title:
Chemical Mass Balance Receptor Modelling
Description:
Chemical Mass Balance Receptor Modelling. Source 1. xi1 i=1,n. Source 2. xi2 i=1,n. Source 3 ... Graphical tools in Excel enable qualitative assessment of model ... – PowerPoint PPT presentation
Number of Views:117
Avg rating:3.0/5.0
Title: Chemical Mass Balance Receptor Modelling
1
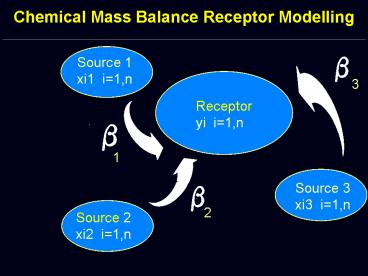
Chemical Mass Balance Receptor Modelling
Source 1xi1 i1,n
3
Receptoryi i1,n
1
Source 3xi3 i1,n
2
Source 2xi2 i1,n
2
Chemical Mass Balance Receptor Modelling
3
Chemical Mass Balance Receptor Modelling
4
Components
- PM
- metals
- ions
- PAH
- OC/EC
- etc.
- Gas phase
- various organic cpds
- VOCs
- etc.
5
Chemical Mass Balance Receptor Modelling Simple
Spreadsheet Implementation
- Electronic spreadsheets like Excel make it easy
to implement the model in the above form. - The Solver function in Excel enables the
minimization operation. - Graphical tools in Excel enable qualitative
assessment of model fit and the inputs.
6
(No Transcript)
7
(No Transcript)
8
(No Transcript)
9
(No Transcript)
10
Chemical Mass Balance Receptor Modelling U.S.
EPAs CMB Model
- There are uncertainties associated with both the
receptor and source profiles. The measured
quantities are thus - The model results then also have uncertainties
associated with them
11
U.S. EPAs CMB Model The effective variance
method
- The CMB model uses an effective variance which
looks at variances in both the receptor, and
source profiles weighted by the source
contributions
12
U.S. EPAs CMB8
- The CMB model incorporates the statistics to
improve our estimate of the source contributions
by weighting the source and receptor profiles
according to the uncertainties associated with
them. - It also reports the uncertainties associated with
the source contribution estimates and goodness
of fit parameters. - Version 8 is windows based, more user friendly.
- Example Source apportionment for motor vehicle
related VOCs in micro-environments
13
VOC's Associated with Motor Vehicles
Exhaust EmissionsEvaporative Emissions
C1 - C10 RangeAlkanesAlkenesAlkynesCycloalkane
sAromatics
14
Chemical Mass Balance Receptor Modelling
Source profile characterization
Fuel
Whole gasoline
Headspace vapor
Individual vehicles
Exhaust emissions - UDDS
Evaporative emissions - SHED
Fleet emission characteristics
Tunnel studies Roadside measurements
15
Source Profiles
16
ERMD Source Profiles with 17 species
0.45
0.4
0.35
0.3
0.25
Fraction of total
0.2
0.15
0.1
6 GA
0.05
5 LPG
4 CNG
0
3 HOTST
2 COLDST
1 FUEL
Ethylene
Ethane
Propane
n-butane
n-pentane
benzene
3m-pentane
e-benzene
o-xylene
17
Modelled Species Profile
3m-pentane m-cyclopentanebenzene
cyclohexane iso-octanen-heptane toluene
n-octane e-benzenemp-xylenen-nonane1,2,4-t
m-benzene
ethylene acetylene ethane propane
isobutane isobutylenen-butane 2m-butane
n-pentane 2,3-dm-butane 2m-pentane
Fitting species
18
Nose-level Ambient Sampling Schedules
Slater Street Curbside 20 Weekdays in
August-September
2 Stations, 3 Sampling Sessions Morning
730-930Noon 1130-1330Afternoon
1530-1730 (Evening 2200 - 2400)
- 3 Underground Garages
- 12 Weekdays in December-January
- 2 Stations, 2 Sampling sessions in each garage
- A.M. 730 - 930
- P.M. 1500 - 1700
19
(No Transcript)
20
(No Transcript)
21
(No Transcript)
Recommended
CrystalGraphics Presentations


