
Using Gliders to Monitor Oregon - PowerPoint PPT Presentation
1 / 36
Title: Using Gliders to Monitor Oregon
1
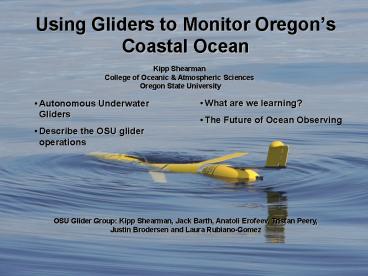
Using Gliders to Monitor Oregons Coastal Ocean
Kipp Shearman College of Oceanic Atmospheric
Sciences Oregon State University
- What are we learning?
- The Future of Ocean Observing
- Autonomous Underwater Gliders
- Describe the OSU glider operations
OSU Glider Group Kipp Shearman, Jack Barth,
Anatoli Erofeev, Tristan Peery, Justin Brodersen
and Laura Rubiano-Gomez
2
Whats a glider?
- Autonomous underwater vehicle a robot!
- Flies by changing its buoyancy
- takes on water, becomes heavy and sinks
- wings turn vertical motion into forward motion
- expels water, becomes light and rises
- flies saw tooth pattern through the ocean
- from the surface to 3 m off bottom (200 m max)
- Slow, but can stay out a long time
- ½ - 1 knot
- 3-4 week endurance
- GPS for positioning
- Communicates to home by Iridium satellite phone
- Collects same data you would on a research vessel
at a fraction of the cost - Research vessel approx. 20K/day
- Glider 100K to buy 200/day (batteries
communications techs) - 400 days of glider operation
- 400 days x 20K/day (100K400 days x
200/day) 7.8 million saved!
3
GPS, Iridium and Freewave Antennae in tail fin
7 ft long 100 lbs in air
Aanderaa Optical Dissolved Oxygen sensor
Glider Control and more batteries
Science Bay
Air bladder
Pitch Batteries
Optical Sensors (Chl, CDOM and Backscatter)
CTD
Webb Slocum Electric Glider
Displacement Pump
4
The OSU Glider Fleet
Two Webb gliders 200 m depth 3 week
deployment SeaGlider (Aug 2007) 1000 m
depth 6 month deployment Two new
SeaGliders (Jul 2008)
Glider Bob February 2005
Bob Smith
Glider Jane June 2005
Jane Huyer
5
OSU Glider Operations
- Newport Line
- 90 km cross-shelf
- Strong currents (50 cm/s)
- Complex Bathymetry
- Historical Observations (1950s)
- Umpqua River Line
- Summer 2007
- April 2006 April 2008
- 506 glider-days
- 12,742 km
- 223 cross-shelf sections
- 65,191 vertical profiles
6
Glider Sections 2-5 days per section 100 500
m along track resolution 0 to 3 mab (200 m
max) Surface every 6 hrs to get GPS fix,
download data and receive new instructions (via
Iridium) 21 day endurance Also measures CDOM
fluorescence and average currents
T (C)
May 05 10, 2006
Salinity
Chlorophyll (µg/L)
Backscatter (1/m)
Dissolved Oxygen (mL/L)
7
Real-Time Glider Data
8
(No Transcript)
9
Students and Gliders
Rice
10
Oregon Field Guide, Episode 1707
The Oregonian Sept 20, 2006
Our 15 minutes of fame.
11
Bob flies through 35 ft seas!
Bob leaks again
Jane and Bob together for CROOS collaboration
Jane off New Jersey
Bob springs a leak
Jane drops emergency weight
First mission We fly till Bob runs out of
batteries
12
2008 Season 2-4 gliders
Winter starts early
Bob disappears for 8 days!!
Bob meets UO fans
Jane Starts Umpqua River Line, springs leak
Jane surf rescue!
Winter get data when weather allows
13
March 2007 Surf Rescue
14
Dan and Ollie save Jane from certain doom
15
(No Transcript)
16
What are we learning?
- The Structure of Upwelling
- Hypoxia on the Oregon shelf
17
Circulation along the US West Coast
shelf currents reverse direction due to winds
and/or river inputs
18
Winds, Ekman Transport and Coastal Upwelling
Northerly winds Offshore Ekman
transport Upwelling brings deep water to the
surface near the coast Deep water cold, nutrient
rich and oxygen poor
19
Summer vs. Winter along the US west coast
blue cold
red warm
The Oregonian July 25, 1996
20
mg/m³
upwelled nutrients feed phytoplankton
courtesy of Andy Thomas (U Maine)
21
Phytoplankton feed copepods
courtesy of Bill Peterson (NOAA/NMFS/OSU)
22
Glider Observations of Upwelling
Very cold water 8 C
23
Glider Observations of Upwelling
Columbia River Plume
Jane drops emergency weight
24
April 5-8
25
April 17-19
26
April 19-23
27
April 27-May 1
28
May 1-5
29
May 5-10
30
What do Glider Observations Reveal about Hypoxia
on the Oregon Shelf?
ODFW
31
(No Transcript)
32
2007
2006
33
The Future of Coastal Ocean Observing
34
Coastal Ocean Observing
35
http//www.orcoos.org
36
Thanks!