
Hydrological Modeling of Lower Altamaha Basin - PowerPoint PPT Presentation
Title:
Hydrological Modeling of Lower Altamaha Basin
Description:
Hydrological modeling involves the mathematical simulation of the response ... Common soil types : Loam - Sand - Loamy Sand. Agriculture dominated (Vidalia Onions) ... – PowerPoint PPT presentation
Number of Views:58
Avg rating:3.0/5.0
Title: Hydrological Modeling of Lower Altamaha Basin
1
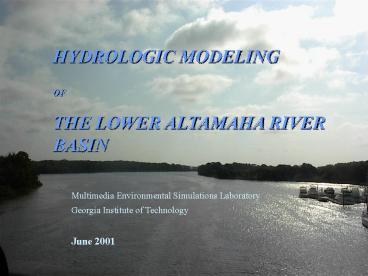
HYDROLOGIC MODELING OF THE LOWER ALTAMAHA RIVER
BASIN
Multimedia Environmental Simulations
Laboratory Georgia Institute of Technology June
2001
2
OUTLINE
1. Introduction 2. Distributed Hydrologic
Modeling 3. Data Requirements 4. Integration with
GIS 5. Lower Altamaha River Basin 6. Example
Application
3
INTRODUCTION
Hydrological modeling involves the mathematical
simulation of the response (hydrograph) of an
hydrologic unit (basin, watershed) to an
hydrological event (precipitation)
- Classification of hydrologic models are based on
- process description
- scale
- solution technique
4
- Combination
- Entirely random
- Entirely physical
Mixed Models
Stochastic Models
Deterministic Models
PROCESSES
Distributed Models
Lumped Models
- Spatial dimensions (X, Y, Z)
- No spatial dimension
5
LUMPED vs. DISTRIBUTED MODELS
LUMPED SYSTEM
DISTRIBUTED SYSTEM
- Watershed averaged data
- Lumped description
- Low maintenance
- Black-box
- Highly Empirical
- Pixel-based data
- Distributed description
- High maintenance
- White-box
- Highly physical
- Spatial non-uniformity
- High requirements for data
- computer resources
6
(No Transcript)
7
(No Transcript)
8
Hydrologic Modeling
SUBSURFACE
SURFACE
Unsaturated Zone Flow
Interception-Evapotranspiration
Infiltration
Saturated Zone Flow
Overland Flow
WATERSHED MODEL
Channel Flow
9
Conservation of Mass Conservation of
Momentum Conservation of Energy
Governing Equations
WATERSHED PROCESSES
Output
Inputs
typically discharge, contaminant concentrations
Global Parameters Non-spatial Data Spatial Data
- Overland Flow Processes
- Subsurface Flow Processes
- Contaminant Transport
Initial and Boundary Conditions
10
MAP ALGEBRA
MAP CALCULUS
vs.
Precipitation data map
Runoff data map
11
DATA REQUIREMENTS
- Main Data Structures
- Raster
- Vector
Ref D. Tarboton
12
GIS REPRESENTATION
13
DATA SOURCES
14
Scale and resolution is not necessarily similar!!!
Possible Other Data Sets
RESAMPLING
Pixel scale attribute data
15
INTEGRATION WITH GIS
- Strong links between distributed modeling and GIS
- Increased availability of large amounts of
spatial data requires suitable processing
software - Data analysis (pre- and post- processing)
- Numerical models running under GIS
- Visualization
- MESL using ArcView and ArcInfo
- Auxiliary software (Remote Sensing and Image
Processing - ENVI)
16
LOWER ALTAMAHA BASIN
- Entire Altamaha Basin
- drains about 1/4 of Georgia
- formed by Ocmulgee Oconee Ohoopee
- 3rd largest basin draining to Atlantic Ocean
- Lower Altamaha Basin
- located at the most downstream point
- area A 3,900 km2
- long term average annual precipitation P 45
inch - long term average Q 14,000 ft3/s
- average elevation E 50 m
17
(No Transcript)
18
- administratively divided by 10 counties
- agricultural activities dominate
- total population (Census 1990)
- watershed 47,740 (0.7)
- 10 counties 185,144 (2.9)
- Georgia 6,478,149
- 0.7 of Georgia population
- total land area
- watershed 3,900 km2 (2.6)
- 10 counties 11,265 km2 (7.4)
- Georgia 152,800 km2
- 2.6 of Georgia land
19
(No Transcript)
20
- Shaded relief of region ---gt Low lands of Georgia
- Topographically not complex but hydrologically is
- Highly vegetated
- Wetlands common in river banks coastal region
- Forests and pasture in other portions
- Mostly pristine (compared to other parts of
Georgia) - Common soil types Loam - Sand - Loamy Sand
- Agriculture dominated (Vidalia Onions)
- Forestry developed
- Main industrial establishments
- The Edwin Hatch Nuclear Power Plant (1630 MW)
near Baxley - Rayonier Pulp Mill at Jesup
21
The Edwin Hatch Nuclear Power Plant near Baxley
on right side of Altamaha
Rayonier Pulp Mill at Jesup on right side of
Altamaha
22
(No Transcript)
23
(No Transcript)
24
- Lower Altamaha river average slope 0.00018 m/m
- Gently meandering nature
- Acts like a conduit with no significant drainage
area - 150 km long corridor has an average width of 26
km - No major navigation activity
25
Little Ocmulgee
Ocmulgee near Lumber City
Altamaha near Baxley
Altamaha Delta
26
(No Transcript)
27
Typical River Channel Vegetation near Coastline
Agricultural land recovered from forest
vegetation in the backyard
Forest Clear Cut
Eutrophication in slow-running sections
28
(No Transcript)
29
EXAMPLE APPLICATION
- SCS Curve Number Method
- runoff is a function of precipitation, initial
abstraction and potential maximum retention
where Q runoff (inch) P precipitation
(inch) S potential maximum retention after
runoff begins Ia initial abstraction (inch)
30
The parameter S is related to soil and cover
conditions of watershed through an hypothetical
parameter called CURVE NUMBER (CN).
- CURVE NUMBER is any number between 0 and 100 and
is a function of - Hydrologic Soil Group (A, B, C, D)
- Land Cover Type
- Land Treatment
- Antecedent Moisture Condition (Dry, Wet, Average)
31
(No Transcript)
32
(No Transcript)
33
PIXEL LEVEL DATA SETS
- Application is coded in C
- Integrated with ArcView v3.2a
- User-friendly GUI
34
Thank you...
Recommended
CrystalGraphics Presentations


