
What is the U'S' Integrated Ocean Observing System - PowerPoint PPT Presentation
1 / 17
Title:
What is the U'S' Integrated Ocean Observing System
Description:
A tool that will enable the Nation to track, predict, manage and adapt to ... Changing sea state: more fog, storms, winds, waves. Information Products Needed. Nowcasts ... – PowerPoint PPT presentation
Number of Views:43
Avg rating:3.0/5.0
Title: What is the U'S' Integrated Ocean Observing System
1
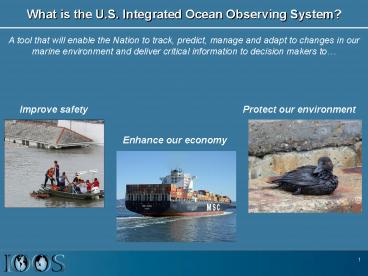
What is the U.S. Integrated Ocean Observing
System?
A tool that will enable the Nation to track,
predict, manage and adapt to changes in our
marine environment and deliver critical
information to decision makers to
Improve safety
Protect our environment
Enhance our economy
2
Why Is IOOS So Important?
- Oceans are a primary driver of weather and
climate - Potential to store 1000X more heat and 50X more
carbon than the atmosphere (ocean acidification)
- 85 of the rain and snow that provides water to
our citizens come directly from the ocean.
3
Background IOOS Subsystems
Effectively and efficiently links ocean
information to user applications
Observing Systems
Data Management and Communications (DMAC)
Modeling and Analysis
Decision support tools to aid informed and timely
decision making
In-situ and remotely sensed ocean information
4
And Extends to a Regional Level
IOOS Regional Component A network of 11 regional
coastal ocean observing systems that meet
national and regional needs for local ocean
observations, data management, and modeling 1
national partnership providing sensor
validation/verification
- Meeting National missions through
- Expanded observations and modeling capacity
- Connections to users and stakeholders
- Implementation of national data standards
- Products transitioned to other regions and to
National operations - Sensor validation/verification
12
- Alaska Ocean Observing Systems (AOOS)
- Caribbean Regional Association (CaRA)
- Central and Northern California Coastal Ocean
Observing System (CeNCOOS) - Gulf Coastal Ocean Observing System (GCOOS)
- Great Lakes Observing System (GLOS)
- Mid-Atlantic Coastal Ocean Observing System
Regional Association (MACOORA)
- Northwest Association of Networked Ocean
Observing Systems (NANOOS) - Northeast Regional Association of Coastal Ocean
Observing Systems (NERACOOS) - Pacific Islands Ocean Observing System (PacIOOS)
- Southern California Coastal Ocean Observing
System (SCCOOS) - Southeast Coastal Ocean Observing System Regional
Association (SECOORA) - Alliance for Coastal Technologies (ACT) Sensor V
V
5
IOOS Regions Supporting IOOS Missions
Sensor Validation and Verification Services
5
6
AOOS is User-Driven
Stakeholder concerns Climate change
impacts Increased coastal erosion Changing
marine ecosystems Unstable sea ice and uncertain
freeze/thaw dates Fewer subsistence
resources More shipping more oil spill
potential Changing sea state more fog, storms,
winds, waves
Data Management Integration Analysis
Observations
Information Products Needed Nowcasts Warnings
bulletins Forecasts Weekly, monthly seasonal
outlooks Futurecasts Scenarios projections
Standards Data discovery Data transport Online
browsing Data archive
Satellites Fixed platforms Ships Drifters Floats A
UVs
Outcomes Meeting Societal Goals
7
AOOS Near-term Priorities
- Data Management
- Demonstration Project Prince William Sound
- HarborNet development
- Planning, coordination, facilitation
8
AK Marine Information System (AMIS)
19
9
Prince William Sound Field Experiment 2009
10
End-to-End PWS Ocean Forecasting System
Deploy Verify
Observatory data
Models
Sensor Platform
PWS Ocean Forecasting Control Center
Data Assimilation
Hypotheses
Questions
Forecast
Nowcast
11
ROMS Nested Modeling
online
3-km
1-km
From Pacific to Gulf of Alaska, and to PWS
offline
12-km
Multi-scale (or nested) ROMS modeling approach
is developed in order to simulate the 3D ocean at
the spatial scale (e.g., 1-km) measured by in
situ and remote sensors
12
(No Transcript)
13
Harbor Observation Network Installation
14
(No Transcript)
15
Planned Gulf of Alaska Ocean Observing
- Use PWS demonstration to develop ocean
circulation, wave, wind, weather forecasts for
GOA expand first to Cook Inlet/Kodiak, then add
on Southeast - Determine what are minimum observing platforms
needed for better forecasts - Identify where web cams can be most useful e.g.,
Cook Inlet ice, other? - Expansion of Harbor Observing Network
- Begin to develop Harmful Algal boom forecasting
capacity - Ocean Acidification monitoring
- Map predict erosion events determine risk
scenarios
16
Planned Arctic Ocean Observing
- Improve sea ice models (better sea ice thickness
measurements) with partners - Take nearshore sea ice monitoring w/ice radar
system at Barrow from research to operational
add new sites develop local sea ice expert
monitoring - Develop nearshore climatology in ice and ice-free
seasons historical sea ice atlas, workshop
plan to add additional monitoring stations to
monitor ocean conditions with real-time updates
ice, winds, temp, acidification, etc. improve
forecasts - Map predict erosion events determine risk
scenarios
17
Planned Bering Sea/Aleutians
- Increase precision of sea ice forecasts based on
work done in Arctic - thickness real-time
conditions - Develop BSAI ocean circulation model (Aleutian
passes moorings, N-S mooring array Bering
Strait array) - Assess establishing HF radar at Unimak Pass and
Bering Strait - Determine wind wave info needed for coastal
erosion forecasts - Develop more intensive monitoring at Bering
Strait, Norton Sound, Bristol Bay, other?