
Welcome to BASI and NovaNET - PowerPoint PPT Presentation
1 / 43
Title:
Welcome to BASI and NovaNET
Description:
fall norms (August-December) and Form B. has spring norms (January ... The BASI Comprehensive Manual is the first in the list. Improving performance. Every day. ... – PowerPoint PPT presentation
Number of Views:55
Avg rating:3.0/5.0
Title: Welcome to BASI and NovaNET
1
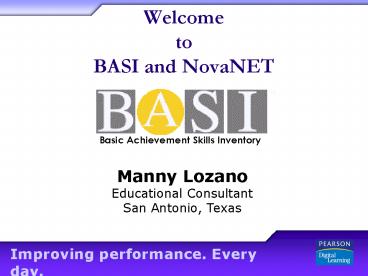
Welcome toBASI and NovaNET
Basic Achievement Skills Inventory
Manny Lozano Educational Consultant San Antonio,
Texas
2
BASI Overview
- Multi-level norm-referenced achievement test
- Grade levels 3 -12
- Developed by Pearson Assessment, PDL and Dr.
Achilles Bardos - Replaces the ABLE
3
BASI Overview
- The BASI series offers
- 4 different grade equivalency levels each with
parallel forms - Level 1 Grades 3-4
- Level 2 Grades 5-6
- Level 3 Grades 7-8
- Level 4 Grades 9-12
4
BASI Overview
- The BASI series offers
- Six subtests
- Vocabulary
- Reading Comprehension
- Spelling
- Language Mechanics
- Math Computation
- Math Application
5
BASI Overview
- BASI tests were
- standardized on a sample of 4,000 students and
2,000 adults - Matched to the 2000 U.S. Census demographic data
- Sample was stratified by race and ethnicity, age,
gender, geographical region and socioeconomic
status
6
BASI Overview
- Each level will have two forms Form A has
- fall norms (August-December) and Form B
- has spring norms (January-July).
7
Subtests
- Each of the six subtests is timed
- Vocabulary - 10 minutes
- Spelling - 10 minutes
- Language Mechanics - 10 minutes
- Reading Comprehension - 30 minutes
- Math Computation - 20 minutes
- Math Application - 35 minutes
8
Assigning Levels
- Tests are to be administered to students
- according to their current grade level. If a
- student is in the 8th grade, they take the
- Level 3 Grade 8 test. If a student has
- enough credits to be considered a
- sophomore, they would take the Level 4
- Grade 10 test.
9
APT Lab and Reports Wizard
- NovaNET will use its standard APT reports to
- deliver BASI scores and information. There
- are four types of reports available through
- the Reports Wizard and APT lab.
- The Student Test List
- The Raw Score and Normed Data Report
- Student Objective Performance Report
- The Student Improvement Report
10
APT Lab
11
Student Test List
12
Print Features
13
Normed Data
14
Raw Data
15
View Student Answers
16
Improvement Report
- The Improvement Report will provide a
- printout of all the students at the site who
- took the test, and it will list their first
- grade equivalence score on the BASI, their
- second grade equivalence score on the
- BASI, and the amount of gain or loss.
17
BASI Improvement Report
18
Student Objective Report
- The Student Objectives Report provides
instructors with data about the performance to
which an individual student taking the assessment
has mastered the learning objectives of a
particular subtest. Data is structured by subtest
and learning objectives, allowing you to track
student performance with the percentage of the
number of test items mastered.
19
BASI Student Objective Performance Report
20
BASIBasic Achievement Skills Inventory
- Test Information and Interpretation
Improving performance. Every day.
21
Raw Data
- The raw data that BASI will return includes
- the grade level and the number of items in a
- given subtest. It will also display the
- number of correct response and the number
- of incorrect responses on any subtest.
22
Normed Data
- Test publishers use several methods to report
test scores so that teachers and parents can
compare an individual students scores with the
scores of other students who took the same test.
23
Grade-Level Equivalent Scores
- Grade-level equivalent scores are determined
by giving a test that is developed for a
particular grade to students in other grades.
For instance, test designers establish
grade-equivalents for a 4th grade test by giving
that same test to students who are in the 6th and
the 2nd grades. - If a 4th grader receives a 6th grade
equivalent score on a 4th grade reading
achievement test, this does not mean that he or
she is ready for 6th grade material. Actually,
the score means that the child reads 4th grade
material as well as the average 6th grader.
24
Normed Data
- Types of normed data
- stanine
- scaled score
- percentile
- NCE
25
Stanine Scores
- Stanine is short for standard nine. The
- name is derived from the fact that stanine
- scores range from a low of 1 to a high of 9.
- A stanine score of
- 1, 2, or 3 is below average
- 4, 5, or 6 is average
- 7, 8, or 9 is above average
26
Stanine Scores
- If a child achieves a stanine score that was
- below average in a particular area, the test
- shows an area in which the child needs
- improvement. If the child achieves an
- average stanine score he or she performed
- at about the same level as most other
- students who took the test. If a child
- achieves a stanine score that is above
- average, it simply means that he performed
- better in that area than other students who
- took the test.
27
Scaled Score
- A scaled score may also be referred to as a
- standard score. It is a raw score transferred
- to a different measurement scale with a
- certain mean and standard deviation. The
- scaled score still compares the performance
- of a student to the performance of students
- who have taken the same test (the norm
- group). The most basic of scaled or
- standard score is the z score (mean of 0 and
SD1).
28
Scaled Score
- Once the raw score is transformed to the z score,
it - can then be converted to any other type of
- standard score with whatever mean and standard
- deviation chosen. Some common standard or
- scaled scores are scores with a mean of 100 and
- standard deviation of 15 T scores-mean of 50 and
- standard deviation of 10 or others with a mean
of - 500 and a standard deviation of 100.
29
Scaled Score
- BASI will use a scaled score of 100 with a
- standard deviation of 15. This is the
- standard score used by most IQ tests,
- enabling an easy comparison between BASI
- achievement and IQ scores.
30
Percentile Scores
- It is important not to confuse percentile scores
with - percentage correct scores. Percentile scores
allow - you to compare one students scores with a group
- of students who took the same test. Percentage
- correct scores simply tell you the number of
items - that a student answered correctly out of the
total - number of items.
31
Percentile Scores
- If a student scored in the 77th percentile on a
test, - that student achieved a score that is higher than
- 77 of the other students who took the same test.
- So, if 1,000 students took the test, the student
in - the 77th percentile scored higher than 770
students.
32
NCENormal Curve Equivalent
- NCEs are normalized standard scores. NCEs have
- a mean of 50 and were constructed to have a
- standard deviation of 21.06. This value was
- selected because it produces an exact match
- between NCEs of 1 and 99 and percentiles of 1 and
- 99. Thus, NCEs have the same range (1 to 99)
- and midpoint (50) as percentiles.
- NCEs are like percentiles. Both an NCE of 50 and
a - a percentile of 50 are exactly average. NCEs do
not - match percentiles at other points (except for 1
and - 99).
33
NCE(Normal Curve Equivalent)
- An NCE gain of zero means that instruction
- produced an average gain. A zero NCE gain does
- not mean that the student or group of students
- learned nothing between pre-testing and post-
- testing. The zero NCE gain simply means that the
- the amount of learning was exactly what would
- have been expected with instruction.
- All NCE gains greater than zero are excellent. A
- NCE gain greater than zero demonstrates that the
- student or group of students has benefited from
- instruction.
34
Customer Link Update
- New documents posted to the Customer Link
Website include
The BASI Comprehensive Manual
The NEW NovaNET Training Guide
35
Accessing the New Documents
Use the dropdown menu to choose NovaNET.
36
Accessing the New Documents
Scroll down to Publications. Choose Users
Guides to access the BASI Comprehensive Manual
37
Accessing the New Documents
The BASI Comprehensive Manual is the first in the
list.
38
Accessing the New Documents
Scroll down to Publications. Choose Training
Guides to access the New NovaNET Training Guide.
39
New NovaNET Training Guide
40
Questionsand Answers
41
Customizing Test Presentation
42
Customizing Test Presentation
43
Hands-on
Group nntrain Signon rug Password rug