
X-ray Diffraction Study Of New York City Aerosols Particles - PowerPoint PPT Presentation
1 / 1
Title:
X-ray Diffraction Study Of New York City Aerosols Particles
Description:
Ph.D. student Nick Steiner -City College of New York. Future work. References ... indarticles.com/p/articles/mi_m0HST/is_5_4/ai91913259 26k. 1 -www.giss.nasa.gov ... – PowerPoint PPT presentation
Number of Views:34
Avg rating:3.0/5.0
Title: X-ray Diffraction Study Of New York City Aerosols Particles
1
X-ray Diffraction Study Of New York City
Aerosols Particles Junior Nkrumah Summer
Program of 2007 CCNY Dr. Jeff Steiner Ph.D.
Student Nick Steiner Dr. Liz Rudolph
Abstract
Discussion/Conclusion
This research is the study of Aerosols in New
York City. Aerosols particles can cause acid
rain as well as cardiovascular and respiratory
problems. Due to the increasing population and
pollution in New York City aerosol concentration
is increasing. Some aerosols are produced
naturally (pollen, spores) and others originate
from burning fossil fuels, human activities and
organic molecules. To determine aerosol
concentration in NYC, samples are collected by
using a system called, Met-One E Bam and
determine the aerosol composition, we use X-ray
diffraction, which is used to find compounds in
the sample by recognizing the structure.
These results are significant because they help
the investigator to identify the particles. Also
with these results the investigator will be able
to figure out the origins of these particles.
One interesting observation about these results
is that even though the scans were taken on
different days they have similar results.
Materials and Methods/sampling
Diagram of (XRD)
Materials and Method analysis
Future work
- We are getting closer to identifying and
classifying aerosols by composition based on the
differences between diffractograms from day to
day. - We will be using X-Ray Fluorescence (XRF) to find
and identify the metals in the aerosols samples - We need to identify large scale changes and
figure out how weather patterns affect the
composition of aerosols.
Introduction
- The study of Aerosols in New York City has
been - one of the major studies in the New York State.
- Aerosols are suspensions of small solid or liquid
particles. - Aerosols can be dust particles. These dust
particles may be dangerous to human health. - Dust particles can cause contamination and can
effect many parts of our earth system. - In 2000-2003 scientists from different locations
measured gaseous aerosols HCL, HNO3 and NH3 in
the Bronx and Manhattan. - When the measurements were collected and
tested, large concentrations were observed in
both boroughs. Scientists
discovered that chemicals that were collected
originated - in wind parcels from from south to west of
- New York.
- City
- E bam (Met-one E bam) is a portable real-time
beta gauge. - E bam is the most reliable machine ever built.
Its ability to collects aerosol particles is very
interesting.
http//images.google.com/image
http//images.google.com/image
http//images.google.com/image
- In the XRD there is a x-ray (beam) that hits the
aerosols. - Diffracted rays are directed to and counted by
the spectrometer.
- X-ray diffraction is used to
identify compounds in
unknowns by recognizing structures. - When a sample is being analyzed by X-ray
diffraction, the beam (x-ray) hits the sample. If
the sample is a solid, the x-ray will be
diffracted and give us unique shapes and pattern.
Experimental Setup
- Met-one E bam was set up on the roof of the
administration building. Air samples were
collected for 24 hours. Particles that were
collected on the silica ribbon filter paper are
then taken to the lab for analysis. - The Aerosols on the Filter paper were placed in a
petri dish for storage. - The sample, was then removed and placed on a
(XRD) background free sample holder. - The slide is then placed in the XRD and examined
with a program evaluating 2-theta angles from 15
to 55 degrees lasting for about 50 minutes. - When samples are done, we then use the Philips
computer program Identify, to find the compounds
present.
References
www.outreach.phy.cam.ac.uk/camphy/xraydiffraction/
xraydiffraction3 Mage, D., Ozolins,G.,
Peterson,.P Webster, A, Orthofer, R Vandeweerd,
V.,Gwayne, M., 1996. Urban air pollution in
megacitices of the world indarticles.com/p/articl
es/mi_m0HST/is_5_4/ai91913259 26k 1
-www.giss.nasa.gov/ dept.physics.upenn.edu/ he
iney/talks/hires/whatis.html
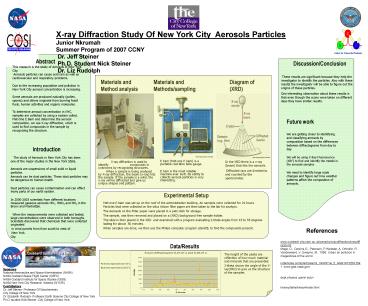
Data/Results
The height of the peaks are reflection of how
much material and minerals that are presented.
2-theta shows the angle of the X-ray(XRD) to
give us the structure of the samples
- Pink lines represents 6-27-07 a
- Blue lines represents 6-26-07 a
Sponsors National Aeronautics and Space
Administration (NASA) NASA Goddard Space Flight
Center (GSFC) NASA Goddard Institute for Space
Studies (GISS) NASA New York City Research
Initiative (NYCRI) Contributors Dr. Jeff Steiner-
Professor Of Geochemistry City College Of New
York. Dr. Elizabeth Rudolph- Professor Earth
Science City College of New York. Ph.D. student
Nick Steiner -City College of New York.