
BioMarker Comparison: Mantel Test - PowerPoint PPT Presentation
1 / 1
Title:
BioMarker Comparison: Mantel Test
Description:
Genes were ranked by the signal-to-noise metric according to ... Other methods compare the absolute values or the number of genes that fall within some cutoff. ... – PowerPoint PPT presentation
Number of Views:91
Avg rating:3.0/5.0
Title: BioMarker Comparison: Mantel Test
1
Statistical Selection and Validation of
Microarray Biomarkers
BioMarker Enrichment KS Test The
Kolmogorov-Smirnov statistic is a non-parametric
rank statistic that we propose to use as a
measure of class enrichment. Feature selection
methods produce a list of genes that are ranked
in the order of their similarity to a class
vector. Comparing a list of say, the top 50
genes, produced by one methodology with the top
50 produced by another method, can be done in
many ways. An obvious comparison is to assess the
average of the distance scores on each list.
Other methods compare the absolute values or the
number of genes that fall within some cutoff.
These techniques are limited because they only
take into account a score function the
similarity of the expression profile to the
phenotype. In contrast, the K-S statistic
additionally measures the quality of feature
lists with respect to a secondary biological
characteristics such as pathway information,
function, genetic, secondary protein structure
etc.
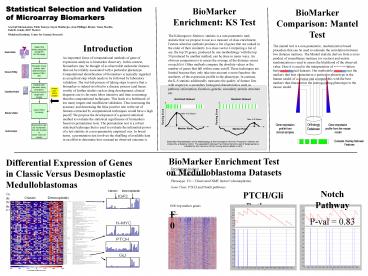
BioMarker Comparison Mantel Test The mantel
test is a non-parametric, randomization based
procedure that can be used to estimate the
correlation between two distance matrices. The
Mantel statistic derives from a cross product of
resemblance matrices (or vectors) and matrix
randomization is used to assess the likelihood of
the observed value. Here it is used in the
interpretation of autocorrelation between
biological datasets. Our methodology determines
the markers that best characterize a particular
phenotype in the human model of a disease and
compare this with the best markers that
characterize the corresponding phenotype in the
mouse model.
Aravind Subramanian, Pablo Tamayo, Sayan
Mukherjee, Jean-Phillippe Brunet, Vamsi Mootha,
Todd R. Golub, Jill P. Mesirov Whitehead
Institute, Center for Genome Research
Introduction An important focus of computational
methods of gene of expression analysis is
biomarker discovery. In this context, biomarkers
may be thought of as observable molecular
features that can be reliably associated with a
particular phenotype. Computational
identification of biomarkers is typically
regarded as an upfront step which needs to be
followed by laboratory validation. The wet-lab
process of taking steps to prove that a biomarker
is indeed involved in a disease process (and
hence worthy of further studies such as drug
development, clinical diagnosis etc) is far more
labor intensive and time consuming than the
computational techniques. This leads to a
bottleneck of too many targets and insufficient
validation. Thus increasing the accuracy and
decreasing the false positive rate in the set of
features extracted by computational techniques
would have a high payoff. We propose the
development of a general statistical method to
evaluate the statistical significance of
biomarkers based on permutation tests. The
permutation test is a robust statistical
technique that is used to evaluate the
inferential power of a test statistic in a
non-parametric empirical way. In broad terms, a
permutation test involves the shuffling of
available data in an effort to determine how
unusual an observed outcome is.
BioMarker Enrichment Test on Medulloblastoma
Datasets
Differential Expression of Genes in Classic
Versus Desmoplastic Medulloblastomas Genes were
ranked by the signal-to-noise metric according to
their correlation with the classic vs.
desmoplastic distinction. Genes shown are those
more highly correlated with the distinction than
99 of permutations of the class labels (p lt
0.01) GenBank accession numbers and gene
descriptions are shown. Genes regulated by Shh
are shown at right. (Data from Pomeroy et al
Nature, Vol 415, 24)
Enrichment Analysis Dataset Medulloblastoma Pheno
type F0 -gt Discovered NMF factor 0
(desmoplastic) Gene Class PTCH and Notch pathways
Notch Pathway P-val 0.83
PTCH/Gli Pathway P-val 0.06
1000 top marker genes
F0
Recommended
CrystalGraphics Presentations


