
QIP Module Learning Objectives - PowerPoint PPT Presentation
1 / 40
Title:
QIP Module Learning Objectives
Description:
Identify the three phases and define the nine steps in the Quality Improvement Process ... provides support, on use of the PSP,QIP, Q-Tools ... – PowerPoint PPT presentation
Number of Views:24
Avg rating:3.0/5.0
Title: QIP Module Learning Objectives
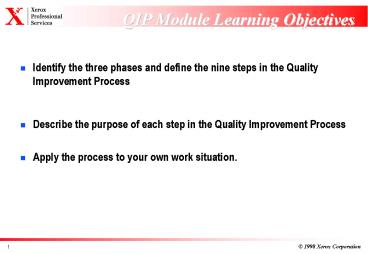
1
QIP Module Learning Objectives
- Identify the three phases and define the nine
steps in the Quality Improvement Process - Describe the purpose of each step in the Quality
Improvement Process - Apply the process to your own work situation.
2
Why Process Improvement?
- Cumbersome, Kafkaesque form filling/approving
marathons - Bureaucratic processes - desire for control
- Divisive functionality - Turf Battles Silo
Management - Over investment in management reporting /
internal customers - Internally driven measures
- Increasing reporting burdens legacy systems
- Focus on symptoms rather than causes, hit
miss reliability - Individual Functions optimise performance
- The customer requirement is for effective
efficient adaptive processes
3
Definition of a Process
A collection of activities that takes one or
more kinds of input and creates an output that is
of value to the customer
Customer Needs
Customer Satisfaction
4
1
Employee travel data and receipts
Employee prepares expense report form, encloses
receipts,signs and submits to secretary
2
Secretary reviews form for completeness, accuracy
and adherence to policy
3
4A
Does report pass exceptions or errors
4
Secretary returns report to employee for rework
5
Manager reviews form for completeness, accuracy
and adherence to policy
6A
Manager notes issue and returns report to
secretary or employee for correction
Does report pass appropriateness review
6
Manager signs and returns to secretary
7
Departmental expense report process
Secretary makes copy
8
Completed original submitted to accounts payable
9
5
- There are 9 steps under 3 subheadings
- Planning for Quality
- Organising for Quality
- Monitoring for Quality
6
Quality Improvement Process Overview
Planning for Quality 1. Identify Output
(Products/Services) 2. Identify Customer 3.
Identify Customer Requirements 4. Translate
requirements into Supplier Specifications
What
Organising for Quality 5. Identify Steps
in Work Process 6. Select Measurements 7.
Determine Process Capability
Monitoring for Quality 8. Evaluate
Results 9. Recycle
How well
How
WORKPROCESS
7
Phase 1 Planning
Planning for Quality 1. Identify Output
(Products/Services) 2. Identify Customer 3.
Identify Customer Requirements 4. Translate
requirements into Supplier Specifications
What you should produce and deliver
8
Planning For Quality Step One
1. Identify Output (Products/Services)
output describes what the team does output
describes product or service at handover point to
customer the end result of the work process the
material that you take action on to add
value noun verb format What are some examples
of the outputs of your work?
9
Planning For Quality StepTwo
2. Identify Customer
Identify customer primary and other customers
clearly identified customer is next in line who
will use or act on output supplier / co-supplier
roles agreed upon Who are the customers for
your work?
10
Planning For Quality Step Three
3. Identify Customer Requirements
Identify Customer requirements what does the
customer want, need or expect of the
outputs customers must be consulted,
requirements identified and verified, do not
assume you know them conflicting requirements
negotiated and resolved where necessary customer
requirements consistent with goals How do you
know what your customer wants?
11
Planning For Quality Step four
4. Translate requirements into Supplier
Specifications
Translate requirements into specifications each
specification relates to a customer
requirement each specification is well defined
and measurable specifications are feasible and
achievable At this stage you should have a
detailed description of what you produce or
deliver based on the customer requirements.
This can be used later to measure how well you
have met them.
12
Effective Meetings Require..
- Goals Purpose and desired outcomes
- Is the meeting really required? In order
to.. - Roles Who should attend
- And what do they do
- Agenda INCLUDING BEGINNING END TIME
- Process Consistent with the goals
13
Exercise
Instructions As a group, complete Steps 1 -4 of
the Quality Improvement Process for your selected
process. Use the QIP checklist if
required Appoint one individual to lead the team
and summarise your work Time 30 minutes
14
Organising For Quality Step five
Organizing for Quality 5. Identify Steps
in Work Process 6. Select Measurements 7.
Determine Process Capability
How to produce and deliver an output that
conforms to customer requirements
Here you should identify and refine the steps in
your work process, identify what to measure and
how, test the process
15
Organising For Quality Step five
Organizing for Quality 5. Identify Steps
in Work Process
Identify steps in the work process this
requires you to list the steps in the work
process as it takes place NOW a flow chart is
required to map out what happens shows all
activities, responsibilities, and decision points
in sequence identifies input and other resources
requirements identifies sensitive points in the
work process where measurements need to be
made identifies key measures which will predict
customer requirements being met
16
A way of Defining, analysing and improving
business processes. Showing how processes are
actually conducted.Providing a sound factual
basis for problem solving and quality
improvement activities.Facilitating
identification of process changes for continuous
improvement.Promoting fact based discussion .
Flowcharting Business processes
17
Parallelogram -- process inputs and
outputsRectangles -- process
activitiesDiamonds -- decision
pointsCircles -- connectorsLines with
arrow heads indicate process direction
Flowcharting Ikons Conventions
18
1
Employee travel data and receipts
Employee prepares expense report form, encloses
receipts,signs and submits to secretary
2
Secretary reviews form for completeness, accuracy
and adherence to policy
3
4A
Does report pass exceptions or errors
4
Secretary returns report to employee for rework
5
Manager reviews form for completeness, accuracy
and adherence to policy
6A
Manager notes issue and returns report to
secretary or employee for correction
Does report pass appropriateness review
6
Manager signs and returns to secretary
7
Departmental expense report process
Secretary makes copy
8
Completed original submitted to accounts payable
9
19
Employee
Secretary
Manager
Employee travel data and receipts
1
Employee prepares expense report form, encloses
receipts,signs and submits to secretary
Secretary reviews form for completeness, accuracy
and adherence to policy
2
3
5
Does report pass exceptions or errors
Manager reviews form for completeness, accuracy
and adherence to policy
4
Y
N
Does report pass appropriateness review
Y
6
4A
Secretary returns report to employee for rework
6A
N
Manager notes issue and returns report to
secretary or employee for correction
Departmental expense report processing
7
Manager signs and returns to secretary
Secretary makes copy
8
Completed original submitted to accounts payable
9
20
Symbols Black Box
REGELS
AKTIVITEIT
INPUT
OUTPUT
MIDDELEN
21
Symbols Black Box
ACTIVITEIT
ACTIVITEIT
ACTIVITEIT
ACTIVITEIT
22
Black box method
Customer request
Sales
Admin
Project Execution
Project delivered
Mainte-nance
23
1. Do not rely solely on existing
documentation2. Assemble a team of individuals
who actually perform the work.3. Begin with each
output, list all the activities4. Initially,
focus on completeness5. Sequence the list of
activities6. Identify which activity steps
represent the key decision points 7. Review for
accuracy and completeness (other experts,
suppliers, customers)
Procesanalyse Guidelines
24
1. Identify the customer(s) and required
output(s)2. Identify the supplier(s) and
required input(s)3. Identify the process
owner(s), that is, the individual(s)with overall
responsibility for defining, inspecting and
improving the process4. Decide Micro or Macro
establish process boundaries, that is, define
which activity / output completes
it5. Determine whether the activities included
in the process are performed by multiple
organisations, multiple functions, multiple
individuals within a single function, or by a
single individual, and whether visually
depicting multiple agents will benefit
you 6 Determine the level of detail required.
Flowcharting Guidelines continued
25
Meeting Roles
Leader / Chairman the formal head of the group,
with concern for content and outcome Facilitator
focuses on the process of the meeting, not the
content external to the group provides support,
on use of the PSP,QIP, Q-Tools Minute taker /
scribe captures and distributes the proceedings
of the session Timekeeper monitors time and
provides updates to group
26
Exercise
Instructions As a group document your selected
process as is using the conventions described.
Where required talk to people who are involved in
the process to get a real picture of what happens
rather than what should happen. Appoint one
individual to lead the team and summarise
your progress ..Remember blame the process not
the person. Time 60 minutes
27
Organising For Quality
Organising for Quality 6. Select
Measurements 7. Determine Process Capability
Select measurements data collection plan
provides necessary information only measures
directly related to customer requirements /
specifications checksheet may be
required Determine process capability collection
and summary of data completed according to
plan data analysis confirms process capability
28
Checksheets
Organising For quality Selecting Measures
- Heading Section
- Date, title, product inspected, examiner,
department, operator, location or lot , etc. - Tally Area
- Reason for the checksheet that links directly
with customer requirements - Remarks Section
- Section for examiner to make special remarks
about the process, the input, or the output that
is, anything unusual that might provide useful
information
Checksheet Example
Heading Title Process Date Tally
Time 1 Time 2 Time 3 Area / Topic
1 Area / Topic 2 Area / Topic 3 Remarks
29
Exercise
Instructions Identify how you would collect the
data using checksheets and charts (Quality
toolkit) Appoint one individual to lead the team
and summarise your work Time 30 minutes
30
Cycle Time Reduction
DEFINITION
A tool for analysing a work process in order to
reduce cycle time.
- Allows us to respond to customer requirements
quickly. - Ratio analysis provides Quantitative measure
for success.
31
What is Cycle Time?
- Definition The total time that it takes to
complete an output. From the customers request,
to acceptance and use, of your product or
service. This can also be referred to as
throughput time.
Input
Output
Cycle Time
If Quality was the weapon of the 80s, Time is
the weapon of the 90s.
32
Input
Output
Batch Processing
Long Set-Up Times
Poor Scheduling
Quality Problems
Poor Housekeeping
Multiple Document Hand-offs
Re-Work
Excessive Supplier Lead Times
Equipment Breakdown
Multiple Inspections
Multiple Signature Levels
Absenteeism
Incongruent Goals
Overview
63
33
Why Cycle Time?
- Time is a universally accepted measure
- Focusing on time puts you in the external
customers line of sight - Direct correlation between Time, Cost, and Quality
The big dont out perform the little, the fast
out perform the slow.
34
Cost
Time is Money
quality
overheads
space
inventory
interest
store
Time spent waiting for next operation
35
Cycle Time 95 /5 Rule
- 95 of process cycle time is non-value added.
- Due to many factors including
- - excessive inventory
- - downtime or idletime
- - overzealous controls /multiple signature levels
- - rework, inspection
- - multiple handoffs
- - waiting in batch
- - internal measures versus customer metrics
- - etc...
- A 50 reduction in cycle time can result in a
20 to 70 Productivity improvement
36
Cycle Time key Components
- Actual Time (A)
- The process steps that actually happen and their
- associated times.
- Theoretical Time (T)
- The process steps that add value to the output.
- Difference
- The process steps that do not add value to the
output.
T D
Efficiency Ratio
T
37
Simplification
Revised
A
A
Current
A2
30 mins
Refinanced contract
A1
Y
Put hold on Special Billing
2 - 3 days
A2
30 mins
A1
Refinanced contract
Y
Put hold on Special Billing
Contract checked againstt SBSO for machine
numbers, mix etc.
Send copy to Field Admin Validation
A4
30 mins
A3
Account Specialist
A6
Match ? Product mix issue referred to
Special Bids, other issues to Account Specialist
Confirm with XF acting as billing agent
(Refinanced contract)
2 mins
A5
N
FAMUS report validated against Contract for
equipment numbers / mix / etc.
A7
45 mins
A6
2 mins
Confirm with XF acting as billing agent
(Refinanced contract)
A13
Match contract ?
Refer to Account Specialist / Special Bids
N
A12
FAMUS report validated against Contract for
equipment numbers / mix / etc.
A7
45 mins
A14
Supervisors complete Special Billing Contract
Requirements forms sections A, B C (SBMS data
input - Yellow Sheets)
Refer to Account Specialist / Special Bids
Match contract ?
45 mins
N
A12
A13
Waiting time
A16
45 mins
Supervisors complete Special Billing Contract
Requirements forms sections A, B C (SBMS data
input - Yellow Sheets)
A14
45 mins
Refinanced contract
Terminate old contract
Y
A16
45 mins
Refinanced contract
Terminate old contract
Y
A18
Allocate contact number
1 min
A17
Admin Officer checks/ corrects Supervisors work
15 min
B
B
Allocate contact number
A18
1 min
38
Cycle Time Example
Time
Activity
Average
Theoretical
SPECIAL CONTRACT BILLING
Decision Making
20 min
15 min
Work
7hrs 36min
7hrs 21min
Waiting
107 days
NIL
Inspection
1 hour 30 min
55 min
Transport
3 days 4 hours 10 min
4 hours 10min
CYCLE TIME BREAKDOWN
Consultation/
1 day 2 min
2 min
Meeting
Changeover
-
-
TOTAL TIME
Approx. 112 days
1 day 4 hours 43 min
39
Quality Improvement Process Phase Three
Monitoring for Quality 8. Evaluate
Results 9. Recycle
8. Did the process work from a) review of in
process measures from step 6 and b) customer
satisfaction? Is the process in control and
delivering a reliable and responsive result based
on charts /data available 9. Based on step 8 are
there further opportunities for improvement to
make the process more efficient reduce or
eliminate errors How can you ensure that problems
get spotted early ? What actions can be taken to
correct process problems
40
Quality Improvement Process
1. Identify Output
Planning for Quality
2. Identify Customer
3. Identify Customer Requirements
4. Translate Requirements into Supplier
Specifications
5. Identify Steps in Work Process
Organising for Quality
6. Select Measurements
7. Determine Process Capability
N
PS
8. Evaluate Results
Monitoring for Quality
Y
PS
9. Recycle
Recommended
CrystalGraphics Presentations


