
State of Washington Office of Financial Management Human Resource Management Report - PowerPoint PPT Presentation
1 / 14
Title:
State of Washington Office of Financial Management Human Resource Management Report
Description:
Continue to sponsor agency training forum. Continue to support employee training and development ... training needed for the employee's current job, to improve ... – PowerPoint PPT presentation
Number of Views:62
Avg rating:3.0/5.0
Title: State of Washington Office of Financial Management Human Resource Management Report
1
State of WashingtonOffice of Financial
ManagementHuman Resource Management Report
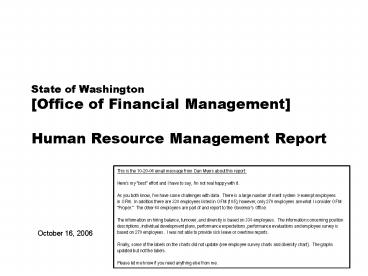
This is the 10-20-06 email message from Dan Myers
about this report Here's my "best" effort and I
have to say, I'm not real happy with it. As you
both know, I've have some challenges with data.
There is a large number of merit system 9 exempt
employees in OFM. In addition there are 338
employees listed in OFM (105) however, only 270
employees are what I consider OFM "Proper." The
other 68 employees are part of and report to the
Governor's Office. The information on hiring
balance, turnover, and diversity is based on 338
employees. The information concerning position
descriptions, individual development plans,
performance expectations, performance evaluations
and employee survey is based on 270 employees. I
was not able to provide sick leave or overtime
reports. Finally, some of the labels on the
charts did not update (see employee survey charts
and diversity chart). The graphs updated but not
the labels. Please let me know if you need
anything else from me.
- October 16, 2006
2
Logic ModelManagers Accountability for Workforce
Management
Plan Align Workforce
DeployWorkforce
Reinforce Performance
Develop Workforce
HireWorkforce
Articulation of managers HRM accountabilities. HR
policies. Workforce planning. Job classes
salaries assigned.
Qualified candidate pools, interviews reference
checks. Job offers. Appts per-formance
monitoring.
Work assignments requirements defined. Positive
workplace environment created. Coaching,
feedback, corrections.
Individual development plans. Time/ resources for
training. Continuous learning environment
created.
Clear performance expectations linked to orgnal
goals measures. Regular performance appraisals.
Recognition. Discipline.
Staffing levels competencies aligned with
agency priorities. Mgrs HRM accountabilities
are understood.
Best candidate hired reviewed during
appointment period. Successful performers
retained.
Workplace is safe, gives capacity to perform,
fosters productive relations. Staff know job
rqmts, how theyre doing, are supported.
Learning environment created. Employees are
engaged in develop-ment opportunities seek to
learn.
Employees know how performance contributes to
success of orgn. Strong performance rewarded
poor performance eliminated
Foundation is in place to build and sustain a
productive, high performing workforce.
The right people are in the right job at the
right time.
Time talent is used effectively. Employees are
motivated productive.
Employees have competencies for present job
career advancement
Successful performance is differentiated
strengthened. Employees are held accountable.
State government has workforce depth breadth
needed for present and future success Employees
are committed to the work they do the goals of
the organization Productive, successful employees
are retained
Agencies are better enabled to successfully carry
out their mission. The citizens receive efficient
government services.
3
Human Resource Management ReportStandard
Performance Measures
- Percent current position/competencies
descriptions - Percent supervisors with current performance
expectations for workforce management - Time-to-fill funded vacancies
- Percent satisfaction with candidate quality New
Hire-to-Promotional ratio - Percent turnover during review period
- Percent employees with current performance
expectations - Employee survey ratings on productive workplace
questions - Leave usage (sick, LWOP, unscheduled leave)
- Overtime usage
- Number type of non-disciplinary grievances
- Percent employees with current annual individual
development plans - Employee survey ratings on learning/development
questions - Percent current performance evaluations
Measures to add in the future Current workforce
plans that align staff with business
priorities Safety and Workers Compensation
measures Competency gap analysis
measure Recognition/reward measure Others to be
determined
4
Overall foundation management accountability
system to build sustain a high performing
workforce
Plan Align Workforce
HR Management Report category
- Performance Measures
- Percent current position/competency descriptions
- Percent supervisors with current performance
expectations for workforce management
- Analysis
- 102 Classified Positions
- 102 CQs or PDFs on File
- 168 Exempt Positions
- 84 CQs or PDFs on File
Agency-wide Percent Current Position Competency
Descriptions 68.5
All classified positions in OFM proper have
position descriptions on file (CQs or PDFs).
Supervisors of exempt positions have always been
required to conduct a thorough job analysis,
identifying key job responsibilities and key
competencies. Descriptions for exempt positions
are in the form of either CQs, PDFs, Workforce
Plans or recruitment documents. OFM has made a
concerted effort to implement the new Position
Description Form. 32 exempt PDFs were on file
in January 2006 this number has increased to 84
as of October 15, 2006.
- Action Steps
- Continue to require Position Description Forms be
developed or updated when - Establishing new positions
- Recruiting to fill vancancies
- Duties/responsibilities change
- Conducting PDP/Performance Evaluations
5
Overall foundation management accountability
system to build sustain a high performing
workforce
Plan Align Workforce
HR Management Report category
- Performance Measures
- Percent current position/competency descriptions
- Percent supervisors with current performance
expectations for workforce management
- Analysis
- All 50 supervisors in OFM proper have
expectations to manage employee performance - 7 supervisors are in the classified service
- 43 supervisors are in exempt positions
Percent supervisors with current performance
expectations for workforce management 100
OFM supervisors have expectations for managing
performance. Policies on performance, diversity,
recruitment, and training are in place and being
managed under the direction of senior leadership.
A consultant recently conducted an organization
review of the agency and concluded that
performance management is being practiced by
supervisors throughout the agency. A recent
agency communication assessment, employee surveys
as well as exit interview data confirm
performance management is an expectation of and
practiced by supervisors. OFM supervisors are
expected to attend HELP, Harassment Prevention,
Diversity Awareness/Management, Ethics, and DOP
Supervisory Training.
- Action Steps
- Continue to ensure supervisors are aware of
expectations to manage performance. - Continue to monitor required supervisor training
- Continue to provide HR assistance to supervisors
in performance management (monitoring and
reporting status of Performance Development
Plans) - Strategic Plan Objectives in place
6
Hire Workforce
HR Management Report category
Right People in the Right Job at the Right Time
- Performance Measures
- Days to fill vacancies
- satisfaction with candidate quality
- new hires promotional hires
- separation during review period
- Analysis
- 2 Probationary Appointments
- 2 Trial Service Appointments into OFM
- 4 Trial Service Appointments with OFM
- 29 Exempt Appointments into OFM
- 30 Exempt Appointments within OFM
- Total of 67 Appointments includes all
appointments made in Agency 105 - No Separations during Review Period to report
Hiring Balance - FY 2006
Total of 67 appointments (2/1/06 10/15-06)
Other (3,926)
This data will be reported by agencies to DOP in
April 2007
Candidate Quality(managers satisfaction rating)
- Action Steps
- Hiring is Balanced no actions planned other than
implementation of the HRMS E-Recruiting System
Separation during Review Period
This data will be reported by agencies to DOP in
April 2007
Released Voluntary
Other transfers, demotions, reassignments,
movement in lieu of RIF, etc.
7
Deploy Workforce
Employee time and talent is used effectively.
Employees motivated.
HR Management Report category
- Performance Measures
- Percent employees with current performance
expectations - Employee survey ratings on productive workplace
questions - Overtime usage
- Sick leave usage Number type of
non-disciplinary grievances and disposition
Percent employees with current performance
expectations 100
- Analysis
- 58 classified employees with PDPs on file 56.9
- 55 exempt employees with PDPs on file 41.9
Data gathered through exit interviews, employee
surveys, organizational unit reviews conducted by
OFM's HR/Management Consulting group as well as
the many agency accomplishments, indicated that
OFM employees know what is expected of them. OFM
revised its evaluation policy on July 1, 2005 and
has been using the PDP tool. The number of
employees with current PDP's has increased from
58 to 112. While not required by WAC,
supervisors of exempt employees are expected to
establish performance expectations and conduct
annual assessments of performance. OFM
leadership encourages supervisors of exempt
employees to follow best practices in the
management of performance of their staff.
- Action Steps
- Continue to track and report PDP completion
- Develop a method for use by agency leadership
that ensures PDPs are developed in accordance
with agency policy - Strategic Plan objectives in place
8
Deploy Workforce
Employee time and talent is used effectively.
Employees motivated.
HR Management Report category
- Performance Measures
- Percent employees with current performance
expectations - Employee survey ratings on productive workplace
questions - Overtime usage
- Sick leave usage Number type of
non-disciplinary grievances and disposition
- Analysis
- Q4 4.38
- Q1 4.10
- Q2 4.23
- Q6 4.25
- Q7 4.61
- Q8 3.71
- Q9 3.83
Overall average score for productive workplace
questions is 4.16
- Action Steps
- Senior Managers of divisions or major works group
are looking for opportunities to improve
DOUBLE CLICK ON THE BAR CHARTS TO ENTER YOUR
AGENCYS DATA
9
Employees have competencies for present job and
future advancement
Develop Workforce
HR Management Report category
- Performance Measures
- Percent employees with current annual individual
development plans - Employee survey ratings on learning
development questions
- Analysis
- Q5 4.18
- Q8 3.71
Percent employees with current Individual
Development Plans 100
- Action Steps
- Continue to develop employee development plans as
part of the new hire process and/or the PDP
development process - Continue to sponsor agency training forum
- Continue to support employee training and
development
Overall average score for Learning
Development questions is 3.94
DOUBLE CLICK ON THE BAR CHARTS TO ENTER YOUR
AGENCYS DATA
OFM has a strong employee development focus. Each
year, OFM sponsors an agency-wide training forum
where employees receive just in time training,
attend required training and learn about the
direction and needs of the agency. In addition,
OFM regularly approves training and education
requests in accordance with agency policy and
budget constraints (this includes requests for
training needed for the employee's current job,
to improve general work performance, for career
development and to meet mandatory training
requirements.
94
10
Successful performance is differentiated
strengthened. Employees are held accountable.
Reinforce Performance
HR Management Report category
- Performance Measures
- Percent employees and managers with current
annual performance evaluations - Employee survey ratings on performance and
accountability questions - Number and type of disciplinary issues, actions,
appeals disposition
- Analysis
- 74 of 102 classified employees with performance
evaluations on file 72.5 - 11 not due - 44 of 168 exempt employees with evaluations on
file 26.2 - 33 not due - Q3 4.36
- Q10 3.18
- Q11 4.12
- Q9 3.83
Percent employees with current performance
evaluations 43.7
Do employees see a meaningful linkage between
their performance and the success of the
organization?
Q3. I know how my work contributes to the goals
of my agency. (4.1) Q10. My performance
evaluation provides me with meaningful
information about my performance. (3.4) Q11. My
supervisor holds me and my co-workers accountable
for performance. (4.1) Q9. I receive
recognition for a job well done (3.3)
Overall average score for performance
accountability questions is 3.87
Action Steps Continue to track and report PDP
completion Develop a method for use by agency
leadership that ensures PDPs are developed in
accordance with agency policy
DOUBLE CLICK ON THE BAR CHARTS TO ENTER YOUR
AGENCYS DATA
11
Successful performance is differentiated
strengthened. Employees are held accountable.
Reinforce Performance
HR Management Report category
- Performance Measures
- Percent employees and managers with current
annual performance evaluations - Employee survey ratings on performance and
accountability questions - Number and type of disciplinary issues, actions,
appeals disposition
- Analysis
- No Disciplinary Actions, Appeals, or Grievances
filed.
Formal Disciplinary Actions, Appeals,
GrievancesFY 2006 to date (July 1, 2005-
February 28, 2006)
DOUBLE CLICK ON THE CHART TO ENTER YOUR AGENCYS
DATA
Non-represented employees Represented
employees
Action Steps
Issues Leading to Disciplinary Action List of
general categories of reasons that agency took
disciplinary action for this time period
Disposition of Disciplinary-related Grievances or
Appeals List disposition of grievances/appeals
for this time period.
12
Ultimate Outcomes
HR Management Report category
State has workforce breadth depth for present
future success. Employees are committed to the
work they do and the goals of the
organization. Successful, productive employees
are retained.
- Performance Measures
- Employee survey ratings on commitment questions
- Turnover rates and types (e.g., retirement,
resignation, etc.) - Turnover rate of key occupational categories -
TBD - Diversity profile turnover TBD
- Analysis
- Q3 4.36
- Q12 3.60
- Q9 3.83
Overall average score for performance
accountability questions is 3.93
Action Steps Strategic plan objectives in
place
DOUBLE CLICK ON THE BAR CHARTS TO ENTER YOUR
AGENCYS DATA
13
Ultimate Outcomes continued
HR Management Report category
- Performance Measures
- Employee survey ratings on commitment questions
- Turnover rates and types (e.g., retirement,
resignation, etc.) - Turnover rate of key occupational categories -
TBD - Diversity profile turnover TBD
Agency-wide Turnoverleaving agency
- Analysis
- Data for FY05 and FY06 are approximate. HRMS
does not provide detail for separations to other
agencies - Data challenges due to Merit System 9 as well as
HRMS
- Action Steps
- No action contemplated at this time
DOUBLE CLICK ON THE CHARTS TO ENTER YOUR AGENCYS
DATA
Agency Workforce Turnover Breakdown
14
Ultimate Outcomes continued
HR Management Report category
- Performance Measures
- Employee survey ratings on commitment questions
- Turnover rates and types (e.g., retirement,
resignation, etc.) - Turnover rate of key occupational categories -
TBD - Diversity profile turnover TBD
Office of Financial Management
DOUBLE CLICK ON THE CHART TO ENTER YOUR AGENCYS
DATA
- Diversity Profile OFM State
- Women 59 52
- Persons with disabilities 4.2 5
- Vietnam Veterans 5.7 7
- Disabled Veterans 1.5 2
- People of color 14.8 17.5
WA State Government
- Notes
- Chart labels did not update
Recommended
CrystalGraphics Presentations


