
The Changing Relationship of Obesity and Disability, 19882004 - PowerPoint PPT Presentation
1 / 1
Title:
The Changing Relationship of Obesity and Disability, 19882004
Description:
Lifting or carrying 10 pounds. Walking between rooms on the same floor ... Includes questionnaire & health exam, including measured height & weight. Methods ... – PowerPoint PPT presentation
Number of Views:34
Avg rating:3.0/5.0
Title: The Changing Relationship of Obesity and Disability, 19882004
1
The Changing Relationship of Obesity and
Disability, 1988-2004
Dawn Alley, PhD1, Virginia W. Chang, MD,
PhD2 1Robert Wood Johnson Foundation Health and
Society Scholars Program, 2Departments of
Medicine and Sociology, University of Pennsylvania
Abstract Recent health changes among the obese
population may have resulted in changes in the
risk of disability associated with obesity.
Using two disability indicators (functional
impairment ADL impairment) a
nationally-representative sample of adults 60,
this study finds an increase in the association
between obesity disability over the 1990s.
- Recent studies suggest that the health of obese
population may have improved since the 1960s - Declining mortality (Flegal et al., 2005 Flegal
et al., 2007) - Declining cardiovascular risk factors (Gregg et
al., 2005) - However, the duration of exposure to disability
is increasing in more recent cohorts (Leveille et
al., 2005) - Obese population could be living longer with
better-controlled risk factors but experiencing
more disability.
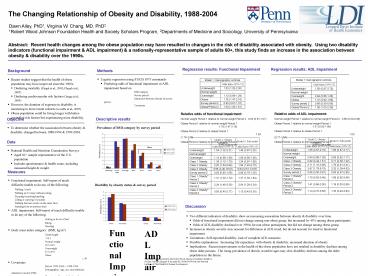
Relative odds of functional impairment Normal
weight Period 1 relative to normal weight Period
2 0.93 (0.81-1.07) Obese Period 1 relative to
normal weight Period 1 1.78 (1.47-2.16) Obese
Period 2 relative to obese Period 1 1.43
(1.18-1.75) Obese Period 2 relative to normal
weight Period 2 2.75 (2.39-3.17)
Relative odds of ADL impairment Normal weight
Period 1 relative to normal weight Period 2
0.66 (0.50-0.88) Obese Period 1 relative to
normal weight Period 1 1.31 (0.92-1.88) Obese
Period 2 relative to obese Period 1 1.03
(0.71-1.51) Obese Period 2 relative to normal
weight Period 2 2.05 (1.45-2.88)
Disability by obesity status survey period
- Two different indicators of disability show an
increasing association between obesity
disability over time. - Odds of functional impairment did not change
among non-obese group, but increased by 43 among
obese participants. - Odds of ADL disability declined over 1990s for
non-obese participants, but did not change among
obese group. - Increases in obesity severity may account for
difference in ADL trend, but do not account for
trend in functional impairment. - Limitations Self-reported disability, lack of
complete ADL measures - Possible explanations Increasing life
expectancy with obesity disability, increased
duration of obesity - Implications Recent improvements in the health
of the obese population have not resulted in
disability declines among obese older persons.
The rising prevalence of obesity at earlier ages
may slow disability declines among the older
population in the future.
Functional Impairment
ADL Impairment
This study was supported by the Robert Wood
Johnson Foundation Health Society Scholars
program by grant K12-HD043459 from the National
Institute of Child Health Human Development.
Recommended
CrystalGraphics Presentations


