
History of Energy Use - PowerPoint PPT Presentation
1 / 35
Title:
History of Energy Use
Description:
Human population in 2000 consumed 5 times as much energy as in 1950. 13 ... Sea salt nuclei. Carbon black. Pollens. Cement dust. Oil smoke. Combustion nuclei ... – PowerPoint PPT presentation
Number of Views:46
Avg rating:3.0/5.0
Title: History of Energy Use
1
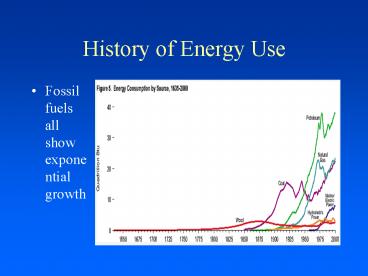
History of Energy Use
- Fossil fuels all show exponential growth
2
Broader time scale
- Fossil fuels will not last forever
3
Carboniferous 354 290 mya
- Famous for vast coal swamps
4
Exponential Growth
- Human population in 2000 consumed 5 times as much
energy as in 1950 - 13 times as much as 1900
5
U.S. Energy Use
6
Development is loosely tied to Energy Use
7
Global Comparison
- U.S. uses 25 of worlds energy
- U.S. is 5 of worlds population
- That means U.S. generates a disproportionate
quantity of pollution associated with energy use
8
London, UK 1952
Central London 48 hours with lt 50 m visibility
For one week, visibility did not exceed 500 m
9
Levels of Airborne Pollutants and Mortality
during Great London Smog, 1952
10
Contributors to Smog Events
- High pressure system
- Industrial air emissions
- Exacerbated by residential air emissions
- (e.g., more coal use when cold)
- Inversions preventing air circulation
11
Results of Smog Events
- Instigated regulatory control of stationary
sources - Point sources required to use best available
control technology (BACT) - Better scrubbers and removal of hazardous
chemicals prior to emission - Smoke stack height to be above inversion layer
12
Mobile SourcesBrown Smog
13
Health Effects of Haze
Spokane WA with smog Spokane WA with no
smog
14
Ground level ozone
- Not emitted directly into air
- Created by UV reactions with NOx and VOCs
- Sources
- Vehicle exhaust
- Gasoline vapors
- Dry cleaners
15
Photochemical Smog
- Formation of brown haze (NOx and VOCs) from
combustion - Exposed to UV
- Creates O3, PANs, nitric acid, aldehydes
16
The Role of Climate and Geography on Air Quality
17
Ozone Creation by Time-of-Day
ppm
40
Nitric oxide
NO2
Ozone
30
20
10
6 am
9 am
12 pm
3 pm
6 pm
8 pm
18
Health Impacts of Ozone
- Trigger chest pain, coughing, throat irritations,
congestion - Worsen existing bronchitis, asthma, other chronic
conditions - Reduce lung function, inflame linings
- Repeated exposure-permanently scars lungs
19
Good vs. Bad Ozone
20
Criteria Pollutants
- PMparticulate matter
- O3ozone
- NOxNitric oxides
- SOxSulfuric oxides
- VOCvolatile organic compounds
- Pblead
- COcarbon monoxide
21
Health Effects of PM2.5
- Across 6 studies in cities across country and gt
11 cities and 40 subsequent studies - Premature mortality
- Chronic respiratory disease
- Respiratory emergency room visits
- Aggravated asthma
- Decreased lung function
- Acute cardiovascular events
22
Why is PM2.5 so harmful?
- Size of particles
- Avoids control mechanisms
- Evades bodys efforts to eliminate contaminants
- Particle composition
- Remains suspended for days to weeks
- Ability to travel 100s-1000s km
Sea salt nuclei
Fly ash
Carbon black
Pollens
Paint pigments
Tobacco smoke
Cement dust
Milled flour
Combustion nuclei
Coal dust
Oil smoke
Metallurgical dust and fumes
Photochemical smog
Insecticide dusts
Average particle diameter (micrometers or microns)
23
Health Impacts of Deisel
24
Health Impacts of Deisel
25
Environmental Justice
- Minority children disproportionately impacted
by photochemical smog and particulate matter - children in US exposed
- (considered at high risk)
- 61 black
- 70 Hispanic
- 68 Asian-American
26
Reducing Exposure
- Pay attention to Air Quality Index and moderate
outdoor exposure, exercise - Reduce emissions from mobile vehicles
- Cars, trucks, lawn mowers, boats, jet skis
- Rely less heavily on items that generate high
emissions - Conservation of electricity
- Reduce use of dry cleaners
- Increase use of gas vapor recovery systems
27
Summary
- Two major types of pollution
- Industrial smog (stationary sources)
- Photochemical smog or Haze (mobile sources)
- Different science behind these two types
- Various health effectsprimarily respiratory and
cardiovascular - Regulations targeted these differently
- Environmental justice concerns about who is most
impacted
28
Ecological Effects of Ozone
- Damages vegetation
- Reduced agricultural crops, forests yields
- Reduces growth, seedling development
- Agriculture alone US estimates 500 million lost
annually - Landscape and aesthetic losses
29
Acid Deposition in US
30
Impacts of Acid Deposition
31
Regional Effects of Acid Deposition
32
Cars use more power
33
Mileage is up
34
Stationary Source Regulations
- Command and control
- Technology-forcing
- Best available control technology (BACT)
- Better scrubbers, higher stacks
- Set criteria for key pollutants
- Some capital/industry oriented controls
- Emission trading
35
Mobile Source Regulations
- Command and control
- Tailpipe regulations
- CAFÉ standards (corporate average fuel economy)
- Concerns
- Population increasing and buying more cars
- Even if per vehicle emission down, total
emissions higher - No real financial incentives to select lower
emission car as individualsonly to sell more
low-emission cars