
Segmenting Customers in Mature Industrial Markets : An Application - PowerPoint PPT Presentation
1 / 22
Title:
Segmenting Customers in Mature Industrial Markets : An Application
Description:
Drawings, costs, scrap rates, usage forecasts, and operations ... Market Share: A deferent measure of dependency is a single supplier's proportion ... – PowerPoint PPT presentation
Number of Views:253
Avg rating:3.0/5.0
Title: Segmenting Customers in Mature Industrial Markets : An Application
1
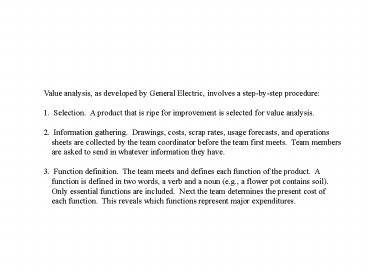
Value analysis, as developed by General Electric,
involves a step-by-step procedure 1.
Selection. A product that is ripe for
improvement is selected for value analysis. 2.
Information gathering. Drawings, costs, scrap
rates, usage forecasts, and operations sheets
are collected by the team coordinator before the
team first meets. Team members are asked to
send in whatever information they have. 3.
Function definition. The team meets and defines
each function of the product. A function is
defined in two words, a verb and a noun (e.g., a
flower pot contains soil). Only essential
functions are included. Next the team determines
the present cost of each function. This
reveals which functions represent major
expenditures.
2
4. Generation of alternatives. Team members
suggest ideas for new and different ways to
accomplish the functions. This is known as
brainstorming. All ideas are recorded and
later culled to a list of manageable size. 5.
Evaluation of alternatives. Alternatives are
evaluated or various factors, including fea-
sibility and cost. This further reduces the
list to one or two good ideas. 6.
Presentation. The final alternatives are refined
and presented to a management into an
analysis change proposals. 7. Implementation.
The approved value analysis change proposal is
translated into an analysis change order
and implemented.
3
MAJOR SEGMENTATION VARIABLES FOR INDUSTRIAL
MARKETS
- Demographic
- Industry which industries that buy this product
should we focus on ? - Company size what size companies should we
focus on ? - Location what geographical areas should we
focus on ? - Operating Variables
- Technology what customer technologies should we
focus on? - User/non-user status should we focus on heavy,
medium, light users or non-users? - Customer capabilities should we focus on
customers needing many services or few services? - Purchasing Approaches
- Purchasing function organization should we
focus on companies with highly centralized or
decentralized purchasing organizations? - General purchase policies should we focus on
companies that prefer leasing ? service
contracts? systems purchases? sealed bidding? - Purchasing criteria should we focus on companies
that are seeking quality? service ? price? - Situational Factors
- Urgency should we focus on companies that need
quick and sudden delivery or service? - Specific application should we focus on certain
applications of our product rather than all
applications? - Size of order should we focus on large or small
orders? - Personal Characteristics
- Buyer-seller similarity should we focus on
companies whose people and values are similar to
ours? - Attitudes toward risk should we focus on
risk-taking or risk-avoiding customers?
4
SUPPLIERS BUYERS FACILITATORS MARKET SEGMENTS
Company Manufacturers Distributors Dealers Co
mpetitors
Government Users
Commercial Market Enterprises OEMS
Industrial distri- butors
Institutions
Manufacturers representatives distributors/dealer
s Transportation firms Advertising agencies
Marketing research firms Banks and insurance
companies
Labor Capital Raw materials Component
parts Equipment
5
Market Segmentation Target Marketing Product
Positioning
1. Identify measurable, relevant, and
operational variable for segmenting the
market. 2. Define macro profiles of
resulting segments. 3. Define micro profiles of
resulting macrosegments
1. Evaluate resulting macro/micro
segments a. Profitability analysis b.
Competitive analysis 2. Decide on market
coverage a. Undifferentiated b.
Differentiated c. Concentrated 3. Select
the target segments(s).
1. Develop product/ market positioning for
each target market selected. 2.
Develop marketing mix for each target
market selected.
FIGURE B-1 A Market segmentation and
product positioning Model
6
TABLE 8-1 Some Macro Variables Used to Segment
the Industrial Market
Variables Examples
Industry Agriculture, mining, construction,
manufacturing, transportation, wholesale,
retail, finance, services Organizational
characteristics Size characteristic Size of
customers parent company, size of
customers business, and number of plants
sold Plant characteristics Size of customers
plant, age of customers plant, inventory
turnover, and degree of automation Location Di
stance from plant, state of plant, and
suburban/ urban/ rural location
7
Economic factors Cyclicality of customers
industry Customers industry Growth rate of
industry and customers growth stage within
the industry ultimate customer of customers
product Competitive forces Degree of
competition in customers industries, ease of
entry in to customers industries, and ease
of customer switching Purchasing
factors Decentralized versus centralized, and
number of levels of purchasing
authority End-use markets Residential/
commercial contractors, coal/ore miners,
foresters, federal/ state highway maintenance
departments, banks/ insurance/ brokerage
houses Product application Small appliance,
computer, television, and airplane manufacturer
s
8
Segmenting Customers in Mature Industrial Markets
An Application
- Segment is the art of identifying distinctive
customer groups that exhibit homogeneous needs.
The point of segmentation is to be able tailor
the marketing mix to address the unique needs of
the various segment. A Number of bases for
segmentation have been offered in the literature,
including.
9
- Demographic descriptors such as geography,
standard industrial classification code, and
account size - Product end-use or application
- Buying situation
- Customer decision-making style
- Customer buying behavior and
- Customer benefits
10
- Figure 1 Potential Buying Behavior Segment
High
B
Value Axis
A
Price
C
D
Market Power Axis
Low
High
Low
Cost-to-Server
11
SEGMENTATION VARIABLE FOR KEVLAR
- For potential fishing boat owners Kevlers
lightness promised fuel savings, increased
speed, and the ability to carry fish weight. - For aircraft designers Kevlar had a high
strength-to-weight ratio. - For industrial plant managers Kevlar could
replace the asbestos used for packing pumps.
12
Buying Behavior Variables From In-House Documents
- Relative Price was a measure of the higher of the
lower price that an account paid relative to
Signodes other national account. Average
discount ranged from 0 to as much as 11.3. - Relative Service was a measure of the higher of
the lower service that an account received
relation to other national account. Signodes
managers identify three important component in
service 1)field sales calls, 2) unbilled parts,
tools, and repair work and 3) application and
engineering service.
13
- Account Size While various aspects of account
size have been identify as influencing buying
behaviors. We measured account size simply as the
total purchase volume of all Signode products in
the most recent 12 month. - Market Share A deferent measure of dependency is
a single suppliers proportion of business in the
buyers total purchase of a product catalog. We
measured this as Signodes share of dollar sales
volume for each account . Knowing Signodes
actual sales to the account, we computed
Signodes market share- an indicator of the
buyers preference for, as well as reliance on,
Signodes product.
14
Buying Behavior Variables From National Account
Reps and NAMs
- For decrease in price
- For increase in price
- For decrease in service
- For increase in service
- Product importance Depending on the application
extent of usage, the importance of steel
strapping varied over Signodes national
accounts.
15
- Switching potential Over the years several
customers had built a trusting relationship with
Signode because of the product of the product or
the service or both - Market knowledge Regardless of the stage of
market maturity, customers very substantially in
their knowledge of competitive product and
prices, they search for information in varying
degrees. - Decision-Making Process (DMP) The complexity of
the buying decision-making process is a
reflection not only of product and vender
characteristic but also of the buying
organizations priorities and purchasing
strategies.
16
Mean values of the buying behavior variables are
shown for each microsegment in Table 2 Table 2
Group Means
Behavior Surrogates
Segment 1 of Accounts 54
Segment 3 of Accounts 22
Segment 4 of Accounts 11
Segment 2 of Accounts 65
1. Relative price
0. 0 3. 6 122,000 54. 2 5. 6 15. 5
-7. 9 4. 9 472,000 67. 8 8. 9 27. 9
-10. 1 5. 6 1,100,000 71. 9 8.7 24. 5
-11. 3 7. 1 2,100,000 68.3 11.8 22. 7
2. Relative service
3. Account size (sales)
4. Market share
5. Percentage increase in sales for price drop
6. Percentage decrease in sales for price raise
17
Behavior Surrogates
Segment 1 of Accounts 54
Segment 3 of Accounts 22
Segment 4 of Accounts 11
Segment 2 of Accounts 65
7. Percentage decrease in sales for services drop
5. 1 1. 2 2. 5 3. 8 4. 0 3. 2
9. 2 3. 0 3. 0 4. 4 4. 5 3. 6
12. 5 5. 2 3. 5 4. 5 4. 6 3. 3
12. 3 7. 3 3. 5 4. 6 4. 7 3. 4
8. Percentage increase in sales for services
raise
9. Product importance
10. Switching potential
11. Market Knowledge
12. DMP complexity
Notes Of the 161 complete data records, the
clustering algorithm omitted nine cases as
outliers. 5 and 6 this is percentage increase or
decrease in sales for a 7 price change. 8 and 9
this is percentage increase or decrease for a
unit of service change.
18
- Decreasing price is unprofitable for Signod
because the estimated increase in sales is far
below the required 20 for every microsegment in
Table 2 (see row 5 in Table 2). - Increasing price is profitable programmed buyer
microsegment- sales decrease of only 15.5
compared with a break-even of 20. It exceeds the
break-even number for all other microsegments
(see row 6 in Table 2). - Decreasing services is profitable programmed
buyer microsegment because the estimated sales
drop in 5.1. It exceeds the break-even of 8 in
all other segments (see row 7 in Table 2) and - Increasing service is barely profitable in the
bargain hunter microsegment-sales increase of
7.3 compared with a break-even of 8. It is far
below this number for all other microsegments
(see row 8 in Table 2)
19
Buying Behavior Microsegments
- Segment 1 Programmed Buyers. Customers in the
micro segment were small and viewed the product
as a routine purchase item. They had the lowest
average sales of any group and were not
particularly price or service sensitive. Compared
to those in the other three micro segment, these
customers had the lowest market share of Signode
products. - Segment 2 Relationship Buyers. Customers in
this micro segment were also relatively small.
The product it self was moderately important in
their operations, and unlike the programmed
buyers of segment 1, they were more knowledge
about competitive offerings.
20
- Segment 3 Transaction Buyers. Customer in the
micro segment were, on average, twice as large as
the relationship buyer. They received price
discounts averaging about 10 and an
above-average service level they had the highest
sensitivity to decreases in services. - Segment 4 Bargain Hunters. Customer in the
micro segment were large-volume customers that
received the largest price discount (averaging
11.3) as well as the highest level of services.
21
- Figure 2 Segment Profile
Segment !
0 (discount)
Augmented Product Buyers
Segment 2 Relationship Buyers Sales 31
million
Value Axis
Relative Price
Segment 3 Transaction Buyers Sales 25 million
Core Product Buyers
-11.3 (discount)
Market Power Axis
Segment 4 Bargain Hunters Sales 23 million
0
2.5
5
7.5
10
22
Conclusion Following the analyses at Signode, we
believe that even a simple framework, such as the
two-dimensional plot of price versus
cost-to-server in Figure 1, is capable of
unearthing a rich subsegment of behaviors in
industrial accounts. As can be seen from the
figure, the diagonal equates the price to
cost-to-server for the seller. We hypothesize
that the sellers profit would be roughly equal
for accounts located on this axis- when customers
want services (augmented product), they are
welling to pay higher prices. The cross diagonal,
however represents an axis of product
differentiation. Clearly, customer who demand and
get high level of services for low prices must
have alternatives, just as those customer who pay
high prices most find the product attractive even
though they do not receive the full battery of
services. Obviously, the sellers profit are
likely to be higher in the northwest and lower
in the southeast quadrant compared with the
diagonal axis. Understandably, the segment
descriptor variable and dimensions are likely to
very across applications, but nevertheless a few
variables could provide rich diagnostics for
management actions.
Recommended
CrystalGraphics Presentations


![Industrial Report on Global ePaper Display Market [2016-2020] PowerPoint PPT Presentation](https://s3.amazonaws.com/images.powershow.com/8302651.th0.jpg?_=20190429078)


