
Scales of Measurement - PowerPoint PPT Presentation
1 / 21
Title:
Scales of Measurement
Description:
Conceptually, r = X & Y covary X & Y vary separately. Example. X Y XY. 1 3 3. 2 6 12. 4 4 16 ... The stability or consistency of scores in measurement ... – PowerPoint PPT presentation
Number of Views:221
Avg rating:3.0/5.0
Title: Scales of Measurement
1
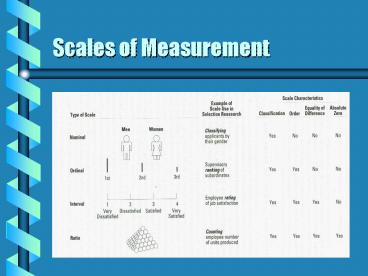
Scales of Measurement
2
Correlation
- Measured with Pearson product moment correlation
coefficient (denoted by r) - Conceptually, r X Y covary X Y
vary separately
3
Example
X Y XY 1 3 3 2 6 12 4 4 16 5 7 35 12 20
66
4
Positive Correlation
Beer Sales
Temperature
5
Negative Correlation
Coffee Sales
Temperature
6
No Correlation
Grocery Sales
Temperature
7
Restricted Range
Job Performance
Selection Device
8
Coefficient of Determination
Predictor
Criterion
r2
X
Y
9
Linear Regression
- Provides simplified description of relationship
between X and Y. - Can be used for prediction.
- Can be presented as a simple equation (Y bX
a) - b slope
- a intercept
10
Measurement Concepts Reliability
- The stability or consistency of scores in
measurement - Test theory suggests that a score has two
components true score and error - Xo Xt Xe
- rxx Xt Xo
11
Types of Reliability
- Test-retest
- Alternate Forms
- Split-half (internal consistency)
- Kuder-Richardson and Alpha
12
Measurement Concepts Validity
- The degree to which the test truly measures
what it is supposed to measure. - Operationalized as the correlation between the
predictor and the criterion (rxy)
13
Validation Strategies
- Criterion-related (predictive and concurrent)
- Content
- Construct
14
Criterion Development
Criterion Relevance
Ultimate Criterion
Actual Criterion
Criterion Deficiency
Criterion Contamination
15
Sources of Criterion Contamination
- Measurement Errors
- Bias
16
Other Statistical Concepts
- Factor Analysis
- Meta-Analysis
17
Group Mean Difference No Test Bias
18
Group Mean DifferenceSlope Bias
19
Group Mean DifferenceIntercept Bias
20
Group Mean DifferenceIntercept Bias
21
Other Measurement Issues in Recruitment and
Selection
- Adverse Impact
- Minimum Cutoff Scores
- Validity Generalization
Recommended
CrystalGraphics Presentations


