
Changes in tilt over time - PowerPoint PPT Presentation
1 / 134
Title: Changes in tilt over time
1
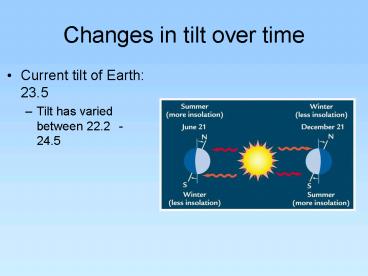
Changes in tilt over time
- Current tilt of Earth 23.5?
- Tilt has varied between 22.2 ?- 24.5?
2
Eccentricity
- Shape of the Earths orbit
- E has varied between 0.005 (more circular) to
0.0607 (more squished) - Shape of the orbit is currently nearly circular
(0.0167)
3
Precession PLUS eccentricity
- Today June solstice occurs near aphelion (most
distant from the sun) - 11,500 years ago, June solstice occurred at
perihelion (closest to sun) - esinw precessional index (eccentricityprecession
)
4
- Using these three orbital variations,
Milankovitch produced a mathematical model that
calculated latitudinal differences in insolation
and the corresponding surface temperature for
600,000 years prior to the year 1800. - He then attempted to correlate these changes with
the growth and retreat of the Ice Ages. - He chose summer insolation at 65 degrees North as
the most important latitude and season to model,
reasoning that great ice sheets grew near this
latitude and that cooler summers might reduce
summer snowmelt, leading to a positive annual
snow budget and ice sheet growth. - FOR ABOUT 50 YEARS THIS THEORY WAS LARGELY IGNORED
5
Milankovitch theory Milankovitch
proposed that low summer insolation is the
critical factor that that allows ice sheets to
grow. WHY?
Changes in insolation calculated using the
Milankovitch theory.
6
How to grow a glacier
- Northern Hemisphere summers are coolest when
- 1) Earth is farthest from the Sun due to
precession and greatest orbital eccentricity - 2) Tilt is at a minimum (less of high latitudes
tilted towards the sun during the summer) - snow can then accumulate on and cover broad
areas of northern America and Europe. - At present, only precession is in the glacial
mode, with tilt and eccentricity not favorable to
glaciation
7
cycles change DISTRIBUTION of insolation over
seasons at different latitudes -up to 20 at
high latitudevery little change in TOTAL
insolation received by Earth
figure shows changes in solar radiation received
on the day of the June solstice compared to today
8
(No Transcript)
9
Why do glaciers form?
10
Why do glaciers form?
- Glaciers form when the amount of snow falling in
the winter is greater than the amount that melts
in the summer
11
How do glaciers form?
- Pore spaces around snow crystals disappear
- Snow becomes denser
- burial and pressure leads to increase in crystal
size
12
Accumulation and ablation
13
Glacier mass balance
14
Ice sheet growth lags behind solar forcing
- Even under the most favorable conditions for ice
sheet growth, it takes thousands of years for ice
volumes to reach a maximum - The rate of ice volume increase is greatest
during coldest times, but the ice sheets dont
reach their maximum size until thousands of years
later
15
Does solstice correspond with the peak (or
minimum) in temperature?
London, England - 52 North, 1 East
Fairbanks, USA - 65 North, 148 West
16
Ice sheet growth lags behind solar forcing
- At the 41,000 yr cycle, ice sheets lag insolation
by 10,000 years - At the 23,000 yr cycle, ice sheets lag insolation
by 6,000 years
17
(No Transcript)
18
(No Transcript)
19
So is this what really happened?
- Where should we look for evidence?
- Ocean sediments
- Records of ICE RAFTED DEBRIS
- records of changes in 18O
- What does the 18O record mean again?
- HIGH 18O in ocean means
- 1) more 16O trapped in ice
- 2) cooler ocean temperatures
20
Shackleton and Emiliani
- continuous delta 18O for the last 2.75 Myr
- Took cores of ocean sediments
- Produced records of changes in 18O from shells of
foraminifera
21
Shackleton and Emiliani
- Two types of variations
- Numerous cycles
- Gradual trend towards positive 18O (cooling)
- Prior to 2.75 Myrno IRD and low 18O
valueswarmer - 2.75 Myr-0.9 Myr 41,000 year cycle (50 cycles!)
- 0.9 Myr-present 100,000 yr cycle, abrupt
melting
22
The mystery of the 100,000 year cycle
23
The mystery of the 100,000 year cycle
- Tilt (41,000 yr) and precession (23,000 and
19,000 yr cycle) should control summer insolation
- Eccentricity (100,000 year cycle) should only act
to moderate precession - But over last 0.9 Myr, 100,000 year cycle is
dominant
24
Poor Milankovitch. . .
- Died in 1958didnt live to see ocean sediment
records - But what would he have thought about the 100,000
year cycle?
25
Possible explanations for the 100,000 year cycle
- 1) Non-linear response of climate system to
eccentricity forcing - Amplification of 100,000 yr forcing
- 2) 100,000 year period is INHERENT time
constraint of climate system with big ice sheets
(slow response time of big ice sheets) - Mid-Pleistocene transition before 1 million
years ago, dominant cycle was 41,000 yr and ice
sheets were smaller in volume - After 1 Ma, dominant cycle is 100,000 yr and ice
sheets are bigger. - Maybe if ice sheets get big enough, they cant
respond to 41 kyr cycle.
26
(No Transcript)
27
Why are 100,000 yr glacial cycles asymmetric?
- Slow ice buildup for 80-90,000 yrs, modulated by
obliquity (tilt) and precession (wobble) followed
by rapid collapse - Climate forcing doesnt have asymmetric pattern.
BUT glacial terminations occur when 65 oN
insolation reaches maximum - Complication climate records from around the
globe are synchronous - Evidence snowlines from Alaska to S. America
all lowered in LGM and glacial terminations all
occur at 15,000 yrs ago.
28
Why does the climate of the N. Hemisphere control
the climate of the S. Hemisphere?
- What can cross the equator?
- OCEAN changes
- Sea level change lower sea level, more land for
ice to grow on Antarctica - Circulation reduction in NADW formation occurs
during glaciations (fig 11-20) - ATMOSPHERIC changes
- Lower CO2 during glaciations can cool whole
planet - Glacial CO2190 ppm, interglacial280 ppm
- Which came first?
- Lower H2O during glaciations, decreased
evaporation, decreased water vapor, less heat
transfer to polesglobal cooling
29
Ice cores and atmospheric gasses
30
The mighty Vostok record
- Records extend back 400,000 yr. .
- . . Newsflash! Records now extend back 600,000 yr!
31
The mighty Vostok record
- Does ice volume correlate with CO2?
- Which came first?
32
How does gas get trapped in ice?
- Pressure causes recrystalization. This blocks
off air passages - Pressure is depth dependant, not time dependant
- Is air younger or older than surrounding snow?
- YOUNGER. Depending on accumulation, can be
gt2,000 years younger
33
It is a miracle that curiosity survives formal
education. Albert Einstein
34
Reminderwhy do we care?
35
Changes in Methane (CH4) concentrations over
glacial cycles
- Cyclic variations of methane
- 23,000 year cycles
- What does this correspond with?
- PRECESSION
- Variations in CH4 suggest changes in TROPICS
- Wet/dry cycles
- What causes changes in wet/dry cycles in tropics?
- MONSOONS
- Increased insolation in June, increased monsoon
strength, increased methane
36
Changes in CO2 concentrations over glacial cycles
- Change from 190 ppm to 280 ppm (90 ppm, 30
change) - Changes in ice volume correlate with CO2. But
which came first? - If CO2 was driver, ice volume should lag CO2 by
several thousand years - Ice volume doesnt laginstead, ice volume lags
insolation
37
Changes in CO2 concentrations over glacial cycles
- Orbital scale changes in ice volume change CO2
- How?
38
What drives changes in CO2 over time?
- 1) Physical oceanographic changes
- 2) chemical oceanographic changes
- 3) terrestrial carbon reserves
- Biomass
- Soil carbon
39
Physical oceans and carbon storage (chapter 11)
- 1) temperature
- If you decrease temp, increase amt of dissolved
gasses9 ppm per 1 oC - 2) salinity
- if you increase salinity, you decrease the amt of
CO2 you can dissolve - Salinity was higher at LGM
- Net result, increased salinity plus decreased
temp STORAGE of 11 ppm CO2 - BUT, we need to account for 79 ppm (190 ppm LGM,
280 ppm pre-industrial)
40
Changes in carbon storage during the LGM
41
Terrestrial reservoirs
- At LGM, 25 LESS vegetation reservoir
- Boreal forests covered w/ ice
- South of ice sheets were steppes
- Drier rainforests
- SO. . .where did extra CO2 go?
42
Changes in carbon storage during the LGM
43
Changes in carbon storage durign the LGM
- Reduced carbon in atmosphere, veg and soils and
surface ocean - Since surface ocean exchanges rapidly with air,
surface ocean is in equilibrium with atmosphere - Where did the rest of the carbon go? Deep ocean
44
Carbon storage in the deep oceans
- How do you get carbon into the deep ocean?
- 1) Carbon pump hypothesis
- Increase productivity in surface ocean (more dead
organic material sinks to deep ocean) - What do you need to increase productivity?
- Nutrients and sunlight
45
Carbon storage in the deep oceans
- How do you get carbon into the deep ocean?
- 1) Carbon pump hypothesis
- Increase productivity in surface ocean (more dead
organic material sinks to deep ocean) - CO2 H20 ? CH2O O2
- What do you need to increase productivity?
- Nutrients and sunlight
46
Carbon storage in the deep oceans
- How do you increase nutrients?
- Increase upwelling of nutrient-rich deep water
- Increase nutrient content (wind?)
47
Carbon storage in the deep oceans
- Changes in ocean chemistry
- At surface, carbonate is supersaturated (CaCO3)
- At depth (4-5 km), water is undersaturated w/
respect to CaCO3 and ocean will dissolve CaCO3
(corrosive) - Hypothesis at LGM, more corrosive deep water
dissolved more carbonate and produced CO3-2 .
When this water upwells, the CO3-2 combines with
CO2 to produce HCO3- (bicarbonate) - End result you decrease CO2 in atmosphere
48
Summarydo we know where the carbon went?
- We lost carbon from the atmosphere
- 280 ppm (pre-industrial) -190 ppm (LGM)90 ppm
CO2 180 gigatons - We lost carbon from the vegetation and soil
- 25 reduction or 530 gigatons
- Carbon is likely stored in the deep ocean. .
.research is ongoing
49
The Last Glacial Maximum
50
LGM
- 21,000 years ago
- Icy! Cold! Windy! Dry!
- But. . insolation levels nearly identical to
today - Why? Remember that ice sheets respond slowly
51
LGM
- Low CO2 levels
- 150-160 meter drop in sea level
- Submerged moraines. . But isostatic rebound of
crust. Makes estimates difficult
52
(No Transcript)
53
Maximum extent of ice at last glaciation
54
CLIMAP reconstructing the LGM
55
Ice sheets at the LGM
56
Retreat of the Laurentide Ice Sheet
Animation by P. Bartlein and J. Shinker
57
(No Transcript)
58
Cordilleran ice sheet
59
(No Transcript)
60
Other types of sediment records from the LGM
- DUST
- Aka?
- LOESS!
- Sources of loess
- DRY climate in general
- Ice sheets, glacial outwash, pluvial lakes
61
Glacial outwash
62
Dust in the Wind
- Winds can blow fine-grained (silt and clay-sized)
material great distances - Evidence from around the globe indicates that
more debris was blowing around during the LGM
63
Dust in the Wind
64
Changes in Vegetation at the LGM
- How were these maps constructed? What is the
data? - Pollen records, models, midden records, etc.
- Vegetation indicates cooler, dryer grass-covered
steppes, tundra, few forests
65
Methods of reconstructing Quaternary flora and
fauna
- Pollen records from lakes
- Packrat midden records
- 28,000 years old! Capitol Reef
- Faunal and archeological records
- Food caches, tools, bones, charcoal, paintings. .
66
(No Transcript)
67
The Pleistocene overkill or climate change?
68
The Pleistocene overkill hypothesis
- Theory championed by Paul S. Martin of the
University of Arizona in Tucson. - A definition of "Overkill" was offered by Martin
(1984) as meaning "the human destruction of
native fauna either by gradual attrition over
many thousands of years, or suddenly in as little
as a few hundred years or less". - His hypothesis uses the fact that extinctions
were most numerous and sudden on continents
humans invaded and where they had not developed
their hunting skills. North America, South
America, and Australia, which were invaded by
humans, all experienced large extinctions,
whereas in Africa and Eurasia, where humans
evolved their hunting techniques, fewer
extinctions occurred.
69
Blame North America megafauna extinction on
climate change, not human ancestors
- "While the initial presentation of the overkill
hypothesis was good and productive science, it
has now become something more akin to a
faith-based policy statement than to a scientific
statement about the past," Donald Grayson, a UW
anthropology professor
70
(No Transcript)
71
(No Transcript)
72
Ice sheets and temperature at the LGM
- North American ice sheets were hugeequivalent to
Antarctic ice sheet today - Glacial world 4 degrees C cooler
- North Atlantic 8 oC cooler
73
Problems with CLIMAP
- Ice height too high (3 km)
- Assumed ice was frozen to bed, so could build up
in height - But most of Laurentide was not frozen to bedmust
have been thinner - Post glacial isostatic rebound indicates height
was 1 km less
74
Other effects of ice on climate
- Enhanced albedo
- Cold wind drainage off ice sheets
- Size of ice reacts w/ atmospheric circulation
- Jet stream (12 km high). Ice sticks up 2 km.
- Jet stream pushed SOUTH
- Results in lots of pluvial lakes in SW
- High pressure over ice, production of glacial
anticyclone? (maybe?)
75
(No Transcript)
76
Paleolakes in the western U.S. during the last
glaciations (pluvial lakes)
77
Pluvial Lakes at the LGM
78
Pluvial Lakes at the LGM
- Do pluvial lakes mean more precipitation?
- Not necessarily. Just less evaporation
79
G.K. Gilbert The father of Geomorphology
B. K. Emerson and G. K. Gilbert examine a rock
specimen found in a glacial moraine. Photographed
by Edward Curtis, 1899.
80
G.K. Gilbert The father of Geomorphology
- 1843 1918
- He was one of 6 original members of the USGS
- He recognized the block-fault nature of the Basin
Range (his term) - He studied problems caused by hydraulic gold
mining in the Sierrassediment transport, and
environmental impact - He was part of the 1899 Harriman Alaska
Expedition -- developed theories about glacial
climate, topography and motion - He figured out the existence of Lake Bonneville
and the Bonneville floods
Gilbert, G. K. (1890). Lake Bonneville U. S.
Geological Survey Monograph 1, 438 pp.
81
Lake level changes of Lake Bonneville
82
- Lake Bonneville represents the highest lake level
at about 5090 feet. - The lake reached this level about 16,000 years
B.P. - A catastrophic event occurred about 15,000 B.P.
in which the natural dam at Red Rock Pass gave
way and released massive amounts of floodwater
into the Snake River Valley. - The lake was lowered by 350 feet as a result of
this single event. - The lake again stabilized about 14,500 years B.P.
when the erosion at Red Rock stabilized and the
Provo level became established.
raven.umnh.utah.edu/units/great.salt.lake/
83
- Estimated that the probable peak discharge of the
flood was 15 million cubic feet per second. - This is to be compared with a maximum historic
discharge in the upper Snake River of 72,000 cfs
at Idaho Falls in June of 1894. - The total flood volume is believed to be about
380 cubic miles.
84
- The Provo stage of Lake Bonneville occurred from
about 13,500-14,500 years B.P. - The lake level at this time was about 4,470 feet
with overflow leaving the lake through Red Rock
Pass, Idaho. - This outlet flowed out to the Snake and Columbia
Rivers and ultimately reached the Pacific Ocean.
85
- The Gilbert stage of the lake occurred from about
11,000-10,000 years B.P. - During this time, the lake rose to a level of
4,250 feet and then began to decline. This level
marks the culmination of historic Lake Bonneville
and the beginning of the Great Salt Lake. This
period shows a transition in climate from cooler,
high precipitation to slightly warmer with less
precipitation.
86
- The Altithermal Period occurred from about 6,000
to 7,000 years B.P. and may have seen complete
dessication (drying up) of the lake. - Ancient sand dunes and buried mudcracks on the
floor of the lake suggest that a warming climatic
trend may have evaporated all or close to all of
the water content of the lake basin.
87
(No Transcript)
88
- Little Ice Age (1400-1800 AD) may have resulted
in higher lake levels. - The lake level at this time may have exceeded
another threshold at 4,217 feet in elevation
increasing the lake level from 2,800 square miles
to 3,700 square miles. The overflow would have
filled the floor of the Great Salt Lake Desert
located to the west of present Great Salt Lake.
89
(No Transcript)
90
Isotasy
In equilibrium, the pressures exerted by
overlying masses of rock will always be the same
at a certain depth.
91
Isostatic rebound
- The mass of glaciers and ice sheets has caused
the surface of the earth to be depressed - Ice depresses underlying bedrock by an amount
to 30 of the ice thickness (height of ice above
landscape represents 70 of its total
thickness) - Since removal of the weight from glacial melting,
the land surface is rebounding
www.uwgb.edu
92
Isostatic rebound
- The mass of glaciers and ice sheets has caused
the surface of the earth to be depressed - Since removal of the weight from glacial melting,
the land surface is rebounding
- http//www.homepage.montana.edu/geol445/hyperglac
/isostasy1/
93
Isostatic rebound and Lake Bonneville
Adams, 1999. Figure 1
pubs.usgs.gov/circ/c1050/first.htm
94
Isostatic rebound and Lake Bonneville
- Tilting of Bonneville shorelines first noticed
by. . GK Gilbert! (1890) - Gilbert theorized the tilting was caused by the
load of the lakefrom this he hypothesized a
liquid substrate beneath the crust - Bonneville shoreline is 74 meters higher in the
center of the basin than at Red Rock pass (on the
margin)
Adams, 1999. Figure 1
pubs.usgs.gov/circ/c1050/first.htm
95
Missoula Floods
96
Missoula Floods
- Harlen J. Bretz 1920-30s
- Box 14.2
- Geologists estimate that the cycle of flooding
and reformation of the lake lasted on average of
55 years and that the floods occurred
approximately 40 times over the 2,000 year period
between 15,000 and 13,000 years ago.
97
- Northern Idaho covered by Cordilleran ice sheet
- Mountain glaciers in the Sawtooths, Bitteroots,
Lost Rivers, Lemhis, Beaverheads, and Salmon
River Mountains
98
The LGM in Idaho
99
OSL 2 - Maldes trench - ladder sample
100
The LGM in Idaho
101
(No Transcript)
102
The LGM in Idaho
103
ELAs (Equilibrium Line Altitude) at the LGM
(Last Glacial Maximum)
104
(No Transcript)
105
Coming out of the LGMthe Bolling-Allerod Warm
Interval
- Bolling-Allerod Period 14,500-12,900 years ago
- Caused by strengthening of NADW formation?
106
Coming out of the LGMthe Bolling-Allerod Warm
Interval
107
(No Transcript)
108
Climate after the LGM
- Deglaciation
- Increased insolation
- Max Solar radiation (long intense summers) 100
th yr cycle - - precession (23th yrs)
- - eccentricity (100 th yrs)
- - perihelion (summer)
- 15,000 - 13,000 yrs ago
- The Bolling-Allerod Warming
- Younger Dryas 12,900 - 11,500 yrs ago
- - pause in warming
- - cold period
- - less snow accumulation
- - some glacial advancement
- - slowed Global melting
- Continued Warming
109
Quaternary Climate change the last 600,000 years
110
The Younger Dryas
- 12,900 - 11,500 yrs ago
- Pause in warming
- Intense Cooling of North Atlantic, near full
glacial cold
111
Younger Dryas Cold Spell
112
Glacial retreat and meltwater
113
North American Ice Sheet Retreat
114
Glacial Lake Agassiz
115
Meltwater Pulses Recorded as pulses of higher
concentrations of d18O values in planktonic
shells
116
Ocean thermohaline circulation Broeckers
conveyor belt
117
The Younger Dryas
- Intense Cooling of the North Atlantic, near full
glacial cold - It is a popular belief that fresh water flooded
the northern Atlantic and altered the
thermohaline ocean circulation - Shut Down of the Conveyor Belt
118
(No Transcript)
119
Evidence of the Younger Dryas
- 1st evidence in European pollen records
- Name derived from an Artic plant called Dryas
- Changes in ocean surface temps of N. Atlantic by
- about 7 degrees C
- Ice Cores from Greenland
- Lower accumulation rates
- Cooler temps in England evident in insect fossils
- Stopped Ice Sheet retreat
- Scandinavia shows glacial advancement
- Slowed Global melting
120
Evidence of the Younger Dryas
121
The Younger Dryas as a freak catastrophic event
- Uncommon event in glacial termination
- Methane levels dropped from 680-460 ppb during
the Younger Dryas - Antartica ice cores show no evidence of Younger
Dryas type events (return to cooling) following
shortly after a period of deglaciation
122
Quaternary Climate change Younger Dryas and
Bolling-Allerod
123
End of the Younger Dryas
- Abrupt ending
- Decades
- Return to warming conditions
- Rapid melting
- Kick start the conveyor belt
- Remember increased ( maximum) solar radiation _at_
100 th yrs - Had a simultaneous affect on large global regions
124
(No Transcript)
125
Lake Agassiz Hypothesis
- Teller suggests that a catastrophic flood of
Glacial Lake Agassiz provided a surge of fresh
water to the N. Atlantic - This abrupt decrease in salinity shut down the
conveyor belt
126
N. American Ice Sheet Drainage Pattern
127
N. American Ice Sheet Drainage
128
(No Transcript)
129
Lake Agassiz Hypothesis
- Melt water from the N. American Ice Sheet was
diverted from the Gulf of Mexico - -evident in a decrease of d18O-deficient glacial
melt-water (using planktonic shells) - (this means more d18O and less d16O) Decrease
in d18O in the St. Lawrence Valley _at_ this time - No sedimentary evidence of Eastern Drainage
- Glaciation dominated the land where previously
proposed drainage patterns exist
130
Arguments against the Lake Agassiz Trigger
- Lack of evidence of a flood drainage channel
- -Later, smaller floods created well defined
canyons - Perhaps the flood used the same channel/s as the
post Younger Dryas floods - As a result of calving, numerous icebergs could
have supplied the fresh water surge - -an abundance of ice rafted debris from this
time suggests a fleet of icebergs
131
More Posssibilities
- The water from Lake Agassiz may have escaped
under the ice, without radiocarbon traces. - An equatorial temperature disturbance may have
triggered a change in the wind pattern over the
Atlantic, permitting ice to form. This may have
resulted in the conveyor shut down.
132
What Caused the Younger Dryas?
- Perhaps YOU can discover the true cause, or at
least make an educated guess!!!
133
Global Warming
- Increased fresh water flow to N. Atlantic
- What does this mean?
- Perhaps another conveyor belt shut down?
- Small changes can produce catastrophic events and
larger changes in the climate
134
Future climates are dependent on how we live
now!!!
Recommended
CrystalGraphics Presentations


