
Mike Ritzwoller - PowerPoint PPT Presentation
Title:
Mike Ritzwoller
Description:
Mike Ritzwoller – PowerPoint PPT presentation
Number of Views:53
Avg rating:3.0/5.0
Title: Mike Ritzwoller
1
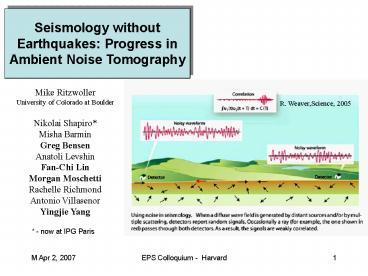
Seismology without Earthquakes Progress in
Ambient Noise Tomography
Mike Ritzwoller University of Colorado at
Boulder Nikolai Shapiro Misha Barmin Greg
Bensen Anatoli Levshin Fan-Chi Lin Morgan
Moschetti Rachelle Richmond Antonio
Villasenor Yingjie Yang
R. Weaver,Science, 2005
- now at IPG Paris
2
Seismology without Earthquakes Progress in
Ambient Noise Tomography
HRV - PFO, 12 months
Mike Ritzwoller University of Colorado at
Boulder Nikolai Shapiro Misha Barmin Greg
Bensen Anatoli Levshin Fan-Chi Lin Morgan
Moschetti Rachelle Richmond Antonio
Villasenor Yingjie Yang
3
Seismology without Earthquakes Progress in
Ambient Noise Tomography
16 sec Rayleigh wave
HRV - PFO, 12 months
Mike Ritzwoller University of Colorado at
Boulder Nikolai Shapiro Misha Barmin Greg
Bensen Anatoli Levshin Fan-Chi Lin Morgan
Moschetti Rachelle Richmond Antonio
Villasenor Yingjie Yang
Oct 04 - Dec 06
4
Seismology without Earthquakes Progress in
Ambient Noise Tomography
Crustal Thickness (km)
Mike Ritzwoller University of Colorado at
Boulder Nikolai Shapiro Misha Barmin Greg
Bensen Anatoli Levshin Fan-Chi Lin Morgan
Moschetti Rachelle Richmond Antonio
Villasenor Yingjie Yang
5
Outline
- The Context Traditional teleseismic surface wave
tomography and its frustrations. - Simulations to illustrate the idea behind Ambient
Noise Tomography (ANT). - Brief description of data processing.
- Status of surface wave tomography across the W.
US using EarthScope Transportable Array data. - Joint inversion for 3-D structure
- ambient noise tomography, teleseismic
tomography, Receiver Functions
6
Broad-Band Waveform Japan to Finland
P S waves precede surface waves. Love waves on
the transverse component. Rayleigh waves on the
vertical and radial components. Both are
observed to be dispersed.
7
Japan to Finland
Sensitivity kernels are spatially extended and
period-dependent.
Surface waves are observed to be dispersed wave
speeds depend on period and also wave type.
8
Dispersion maps result of a linearized inversi
on differ with period and with wave type of
measurement Rayleigh vs Love and phase vs group
speed azimuthal anisotropy estimated at the
same eime.
9
Inversion of dispersion curves
All dispersion maps Rayleigh and Love wave group
and phase velocities at all periods
Monte-Carlo sampling of model space to find an
ensemble of acceptable models
10
JGR, 2002
JGR, 2003
Geology, 2005
Nature, 2002
11
(No Transcript)
12
Frustrations of Teleseismic Surface Wave
Tomography
- Poor lateral resolution -- results from large
epicentral distances wide sensitivity kernels. - Poor constraints on the crust -- results from
difficulty in measuring short period (lt15s)
dispersion caused by attenuation, also due to
large epicentral distances.
13
dispersion maps
high resolution tomography of the Californian
crust from ambient seismic noise
18 sec dispersion map from global 3D model
14
EarthScope Vision
15
EarthScope Vision
16
Outline
- The Context Traditional teleseismic surface wave
tomography and its frustrations. - Simulations to illustrate the idea behind Ambient
Noise Tomography (ANT). - Brief description of data processing.
- Status of surface wave tomography across the W.
US using EarthScope Transportable Array data. - Joint inversion for 3-D structure
- ambient noise tomography, teleseismic
tomography, Receiver Functions
17
The Idea of the Method
Set-up of the Simulation 2 stations
18
The Idea of the Method
Add a source
19
The Idea of the Method
Add a source Zoom around receivers
20
The Idea of the Method
1
2
2
time (sec)
1
time (sec)
21
The Idea of the Method
Add another source randomly
1
2
2
time (sec)
1
time (sec)
22
The Idea of the Method
Two sources in line with the stations
1
2
2
time (sec)
1
time (sec)
23
The Idea of the Method
2
time (sec)
1
2
1
time (sec)
Green function for propagation between the
stations.
cross- correlation
lag (sec)
24
The Idea of the Method
Azimuthally homogeneous distribution of sources
1000s of sources, over 30 days
2
time (sec)
1
time (sec)
25
The Idea of the Method
Azimuthally homogeneous distribution of sources
1000s of sources, over 30 days
cross-correlation
lag (sec)
26
The Idea of the Method
Azimuthally homogeneous distribution of sources
1000s of sources, over 30 days
cross-correlation
lag (sec)
theoretical Green function
27
The Idea of the Method
Azimuthally inhomogeneous distribution of sources
1000s of sources, over 30 days
cross-correlation
lag (sec)
lag (sec)
lag (sec)
theoretical Green function
28
Outline
- The Context Traditional teleseismic surface wave
tomography and its frustrations. - Simulations to illustrate the idea behind Ambient
Noise Tomography (ANT). - Brief description of data processing.
- Status of surface wave tomography across the W.
US using EarthScope Transportable Array data. - Joint inversion for 3-D structure
- ambient noise tomography, teleseismic
tomography, Receiver Functions
29
Ambient noise data processing
- Processing Steps
- Remove instrument response, de-mean, de-trend,
bandpass filter, time-domain normalization,
spectral whitening - Cross-correlation 1 day at a time.
- Stack over many days.
- Waveform selection for tomography
30
Ambient noise data processing
- Processing Steps
- Remove instrument response, de-mean, de-trend,
bandpass filter, time-domain normalization,
spectral whitening - Cross-correlation 1 day at a time.
- Stack over many days.
- Waveform selection for tomography
31
Measurement of group and phase speed dispersion
phase speed
group speed
Rayleigh wave
32
Longer time series are better
33
ANMO - SSPA Signal Emergence
34
Measurements are repeatable different temporal
subsets seasonal variability
Path Holland to Hungary
basis for the formal error analysis
35
Measurements cluster
36
Outline
- The Context Traditional teleseismic surface wave
tomography and its frustrations. - Simulations to illustrate the idea behind Ambient
Noise Tomography (ANT). - Brief description of data processing.
- Status of surface wave tomography across the W.
US using EarthScope Transportable Array data. - Joint inversion for 3-D structure
- ambient noise tomography, teleseismic
tomography, Receiver Functions
37
First results from ANT (March 2005)
TA (August, 2004) 62 stations
Shapiro, Stehley, Campillo, Ritzwoller,
Science, Mar 2005
38
dispersion maps
high resolution tomography of the Californian
crust from ambient seismic noise
Central Valley
Ventura basin
Imperial Valley
LA basin
39
dispersion maps
high resolution tomography of the Californian
crust from ambient seismic noise
Sierra Nevada
Sacramento basin
Franciscan formation
Peninsular Ranges
Salinean block
San Joaquin basin
40
Current Status of the EarthScope USArray
Feb 12, 2007
Courtesy of the EarthScope website earthscope.or
g
41
(No Transcript)
42
16 sec
43
Work of Morgan Moschetti
8 sec
24 sec
30 sec
40 sec
44
Love waves and phase speeds..
16 s Rayleigh phase
16 s Love phase
Work by Fan-Chi Lin
45
Stations on a larger scale results extend to
longer periods
Work by Greg Bensen
46
12 second period group speed
47
Sediment model of Laske and Masters
48
12 second group velocity and sediment thickness
49
Bouguer gravity and 25 second phase velocity
50
Teleseismic and ANT 60 second phase velocity
Phase velocity (km/sec)
Phase velocity (km/sec)
51
Results from elsewhere on the globe
13 sec group
25 sec phase
30 sec group
Europe Rachelle Richmond
South Africa Yingjie Yang
New Zealand Fan-Chi Lin
52
How do we Know if These Results are an
Improvement Over Traditional Earthquake
Tomography?
Various lines of evidence
- Resolution is better, maps extend to shorter
periods, .. - Agreement with other kinds of data. (e.g.,
gravity) - Agreement with known structures.
- e.g., sedimentary basins, mountain roots,
volcanic features. - Repeatability of measurements.
- Seasonal variability is the basis for
uncertainty estimates on the measurements. - Coherence of measurements.
- Fit to ambient noise measurements during
tomography, compared - with fit to earthquake based measurements during
tomography. - Agreement with earthquake records.
53
Comparison with Earthquake Records Short paths
MLAC-PHL
SVD-MLAC
5 - 10 s
10 - 20 s
54
Comparison with Earthquake Records Longer paths
Earthquake near PFO
55
Outline
- The Context Traditional teleseismic surface wave
tomography and its frustrations. - Simulations to illustrate the idea behind Ambient
Noise Tomography (ANT). - Brief description of data processing.
- Status of surface wave tomography across the W.
US using EarthScope Transportable Array data. - Joint inversion for 3-D structure
- ambient noise tomography, teleseismic
tomography, Receiver Functions
56
Inversion for 3D Structure
Work of Morgan Moschetti
Phase velocity
40 sec
Group velocity
8 sec
8 sec
57
Crustal Thickness Monte-Carlo
Best-Fitting Model
Standard-Deviation
(km)
58
Monte Carlo Inversion Constrained by Receiver
Function Crustal Thickness
Moho Depth from RF
Surface waves alone
Zhu Kanamori, 2000 Yan Clayton, 2006
Surface waves RF
59
Crustal Thickness
ZhuKanamori, 2000 YanClayton, 2006
60
Crustal Thickness
ZhuKanamori, 2000 YanClayton, 2006
61
Receiver Functions Alone
Surface Waves Alone
So Cal CalTech Else U So Carolina
62
Receiver Functions Alone
Surface Waves Rec Fcns
So Cal CalTech Else U So Carolina
63
10 -15 km
15 - 20 km
64
Problems and Prospects for 3D Vs Model
Construction using ANT
Up-Side Potential 1. Apparent high resolution.
2. Strong constraints on crustal structure. 3.
Crustal thickness reconcilable with
RFs. Down-Side On regional scales, weak
constraints on the mantle. Next Step Integrate
with a new high resolution teleseismic method,
called two-plane-wave tomography (Forsyth, Li,
Yang) complementary to ANT similar resolution,
tighter mantle constraints.
65
Two Plane Wave Approximation
Forsyth, Li, Yang et al.
Incoming wavefront models corrugations and
dephasing. Tomography inter-station phase
and amplitude anomalies distributed spatially
are interpreted in terms of phase velocities
within the footprint of the array. Result high
resolution phase speed maps from 25 - 150 sec
period, constraining the upper mantle.
Regional Array
66
Phase velocity maps at 25 sec
Work of Yingjie Yang
Work of Morgan Moschetti
Ambient Noise Two-Plane Wave
67
Upper mantle structure
Work by Yingjie Yang
68
Conclusions and Frontier Issues
Conclusions
- Ambient noise tomography (ANT) provides new
constraints - at relatively high resolution on crustal and
uppermost mantle - Vs and crustal thickness
- Rayleigh and Love wave group and phase speeds.
- Used with other data (Receiver Functions,
Two-Plane Wave - Tomography) in the context of extended arrays
(e.g., USArray TA), - ANT promises to produce better crustal and
uppermost mantle - models over large regions.
Frontier Issues
- Source phenomenology and physics.
- Anisotropy radial and azimuthal.
- Hazards
- constraints on community 3D models (e.g., SCEC,
N. CA). - location event characterization.
69
Greens Functions From Ambient Noise Provide New
Constraints on 3D Models
CVS
10-20 s
8-14 s
FARB
Q03C
MNRC
Body-waves?
HOPS
Vertical-to-vertical component cross-correlations
between stations provided by Morgan Moschetti and
Mike Ritzwoller (University of Colorado). Synthet
ic computed with point force.
70
30 sec Rayleigh 2-Psi
SKS Splitting -- Fast Axes
1 deg 1
Data Courtesy of Thorsten Becker
Recommended
CrystalGraphics Presentations


