
Legislative Accountability Report 2003 - PowerPoint PPT Presentation
1 / 44
Title:
Legislative Accountability Report 2003
Description:
THE STUDENTS' CHOICE: EDUCATION FOR DEMANDING TIMES. MINNESOTA STATE COLLEGES AND ... Net Cost 1 (NC1) Average total budget minus federal and state grants ... – PowerPoint PPT presentation
Number of Views:8
Avg rating:3.0/5.0
Title: Legislative Accountability Report 2003
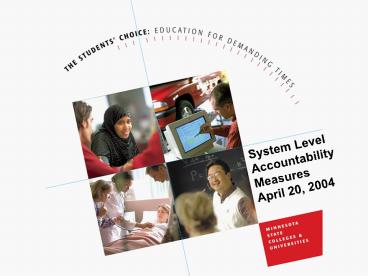
1
System Level Accountability Measures April 20,
2004
2
STRATEGIC DIRECTION ACCESS OPPORTUNITY
- Indicator Access to Programs Courses
- Core Measures of Affordability
- Measure1C1 Undergraduate student affordability
- Measure 1C2 Trend in Tuition and Required Fees
as a Percent of Family Income - Contextual Measure
- Measure 1C1 Context Comparable measures from
national study
3
STRATEGIC DIRECTION EXPAND HIGH QUALITY LEARNING
AND SERVICES
- Indicator Student Learning
- Core Measure of Transfer Student Success
- Measure 6B Student success at transfer
institution versus non-transfer students - Three data sources
4
AFFORDABILITY MEASURE 1C1
- Definition Net cost of attending a System
institution as a percent of total cost two
measures - Net tuition and fees
- Net total budget
- Numerator Cost minus financial aid
- Denominator Cost
- Fiscal Year 2003 is the first year for which
complete financial aid data are available
5
AFFORDABILITY MEASURE CONTEXT AND IMPLICATIONS
- Uses same methodology as National Postsecondary
Student Aid Study conducted every four years by
the U. S. Education Dept. - National and Minnesota context
- Answers Questions
- How much do System students pay to attend?
- What percent of their costs do System students
pay? - How do System students costs and percent of
costs change over time?
6
AFFORDABILITY MEASURE 1C1 NET TUITION AND FEES
- Average Tuition and Required Fees
- Net Tuition 1 (NT1) Average tuition and
required fees minus federal and state grants and
scholarships as a percent of average tuition and
required fees - Net Tuition 2 (NT2) Average tuition and
required fees minus all grants and scholarships
as a percent of average tuition and required fees
7
AFFORDABILITY MEASURE 1C1 NET TOTAL BUDGET
- Average Total Budget or Cost of Attendance
Includes - Estimated tuition required fees
- Book supply expenses and
- Other living expenses.
- Net Cost 1 (NC1) Average total budget minus
federal and state grants scholarships as a
percent of total budget.
8
AFFORDABILITY MEASURE 1C1
- Net Cost 2 (NC2) Average total budget minus all
grants scholarships as a percent of total
budget. - Net Cost 3 (NC3) Average total budget minus all
grants, scholarships and loans as a percent of
total budget.
9
UNDERGRADUATE STUDENTS BY FINANCIAL AID STATUS IN
FY 2003
Total 213,464 students enrolled in Fall or
Spring
10
INCOME DISTRIBUTION FINANCIAL AID APPLICANTS
Dependent Students 57,275 Independent Students
42,517 Total 99,792
11
FINANCIAL AID DOLLARSBY SOURCE AND TYPEFY 2003
Source of Financial Aid Funds
Type of Financial Aid
Dollars in Millions
Total Aid 547 Million
12
PERCENT OF STUDENTS RECEIVING FINANCIAL AID BY
TYPE FY 2003
Total Recipients 118,231
13
AVERAGE FINANCIAL AID AWARDBY TYPE FY 2003
Total Recipients 118,231
14
COSTS AVERAGE TUITION FEES AND AVERAGE TOTAL
BUDGET FY 2003
15
TRENDS IN FINANCIAL AID TUITION 2001 to 2003
Financial Aid per FYE
Grant per FYE
Loan per FYE
Work Study per FYE
State Grant Average
Pell Grant Average
Average Tuition Fees
Measure 6B2.1
16
TRENDS IN FINANCIAL AID TUITION 1995 to 2003
Financial Aid per FYE
Grant per FYE
Loan per FYE
Work Study per FYE
State Grant Average
Pell Grant Average
Average Tuition Fees
Measure 6B2.1
17
NET TUITION FEES AND NET COST ALL FULL TIME
STUDENTS
Measure 1C1Average Tuition Fees
3,527Average Total Budget 12,297
18
NET TUITION FEES 2 (NT2) AS OF TUITION FEES
Measure 1C1.1
19
NET COST 3 (NC3)AS OF TOTAL BUDGET
Measure 1C1.1
20
NET TUITION FEES 2 (NT2) AS OF TUITION FEES
BY INCOME
Measure 1C1.1
21
NET COST 3 (NC3) AS OF TOTAL BUDGET BY INCOME
Measure 1C1.1
22
NET COST 3 AS OF TOTAL BUDGET BY INCOME,
RACE-ETHNICITY METRO
Measure 1C1.1
23
REMAINING NET COST 3 AFTER SUBTRACTING FAMILY
CONTRIBUTION
Measure 1C1.1
24
NET COST 3 AS OF TOTAL BUDGET SYSTEM VS. U.S.
INSTITUTIONS
Measure 1C1.1
25
AFFORDABILITY MEASURE 1C2
- Definition Tuition fees as a percent of income
for a family of four - Two income levels
- MN median family income
- 150 percent of poverty level
- Numerator Average tuition and required fees at
colleges and universities - Denominator Income
26
TUITION FEESAS PERCENT OFMEDIAN FAMILY INCOME
Measure 1C2
27
TUITION FEESAS PERCENT OFLOW FAMILY INCOME
Measure 1C2
28
TRANSFER STUDENT SUCCESS MEASURE 6B
- Definition Transfer student performance is
compared to that of non-transfer students on four
measures - Cumulative GPA at graduation
- Cumulative credits earned at graduation
- Persistence rate
- Graduation rate after 3 and 6 years
- Groups of transfer and non-transfer students are
compared based on their student classification,
ie. Freshmen, sophomore, etc.
29
TRANSFER STUDENT SUCCESS CONTEXT AND IMPLICATIONS
- Context is within each institution and group of
institutions. - Answers Questions
- How well do System transfer students to at their
subsequent institution? - How does transfer student performance compare to
that of non-transfer students? - How does transfer students performance change
over time?
30
TRANSFER STUDENT SUCCESS MEASURE 6B COMPONENTS
- Cumulative Grade Point Average GPA for all
courses taken at the receiving institution. - Initial term
- Last term Enrolled
- At Graduation
- Cumulative Credits Earned Total credits earned
or transferred-in at receiving institution. - Initial term
- Last term Enrolled
- At Graduation
31
TRANSFER STUDENT SUCCESS MEASURE 6B COMPONENTS
- Spring Persistence Rate
- Next Fall Persistence Rate
- Graduation Rates
- Three-Year Rate
- Six-Year Rate
32
TRANSFER GPACOMPARED TONON-TRANSFER
Measure 6B2.1
33
TRANSFER GPA AT GRADUATION COMPARED TO
NON-TRANSFER
Measure 6B2.1
34
TRENDS IN TRANSFERGPA COMPAREDTO NON-TRANSFER
Measure 6B1
35
TRENDS INTRANSFER GPAAT GRADUATION
Measure 6B1
36
TRANSFER CHANGEIN GPA COMPARED TO NON-TRANSFER
Measure 6B2.1
37
TRANSFER CUM CREDITS EARNED COMPARED TO
NON-TRANSFER COLLEGES
Measure 6B1.2
38
TRANSFER CUM CREDITS EARNED COMPARED TO
NON-TRANSFER UNIVERSITIES
Measure 6B1.2
39
TRANSFER PERSISTENCE COMPARED TONON-TRANSFER
Measure 6B2.1
40
TRENDS IN TRANSFER PERSISTENCE RATE COMPARED TO
NON-TRANSFER
Measure 6B2
41
TRANSFER 3-YEAR GRAD RATE COMPARED TONON-TRANSFER
Measure 6B2.1
42
TRENDS INTRANSFER 3-YEAR GRADUATION RATE
Measure 6B2
43
TRANSFER 6-YEAR GRAD RATE COMPARED TONON-TRANSFER
Measure 6B2.1
44
NEXT STEPS
- Measure 1C3 Cumulative Debt Burden of Graduates
- Measure 5B Course Transfer
- Measure 6B Student Pass Rates on Certification
and Licensure Exams - Additional measures recommended by the
Accountability Drafting Team in March 2004