Introduction to the basics of 12Lead EKG Interpretation - PowerPoint PPT Presentation
1 / 37
Title:
Introduction to the basics of 12Lead EKG Interpretation
Description:
Introduction to the basics of 12-Lead EKG ... Electrical recording of the heart's electrical activity ... Contain contractile proteins actin & myosin ... – PowerPoint PPT presentation
Number of Views:284
Avg rating:5.0/5.0
Title: Introduction to the basics of 12Lead EKG Interpretation
1
Introduction to the basics of 12-Lead EKG
Interpretation
- Jennifer Rodgers, MSN, ARNP
- Wichita State University
- Summer 2006
2
INTRODUCTION
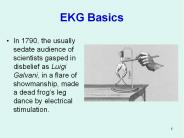
- 12-Lead EKG machine developed in 1903 timeless
invention - Inexpensive, easily accessible
- Goals
- 1. Review basic cardiac physiology
- 2. Develop systematic approach to 12-Lead
- interpretation
- 3. Practice interpreting EKG strips
3
12-Lead EKG
- Electrical recording of the hearts electrical
activity - Cardiac cells resting state polarized (negative
inside positive outside) - Ensure appropriate distribution of ions
(potassium, sodium, chloride, calcium) - Depolarization-fundamental electrical event of
the heart, stimulationgtmuscle begins to work - Propagated from cell to cellgtwave throughout
entire heartgtflow of electricity
4
TYPES OF CELLS
- PACEMAKER-electrical source
- ELECTRICAL CONDUCTING-hard wiring
- MYOCARDIAL-contractile machinery
5
PACEMAKER CELLS
- Small 5-10 cm in length
- Depolarize spontaneously _at_ particular rate
- Located in Right Atrium-Sinoatrial (sinus) node
- Typical 60-100 beats/minute
- Dependent on autonomic nervous system and body
demands
6
ELECTRICAL CONDUCTING CELLS
- Long-Thin cells
- Rapidly carry currents to distant regions of heart
7
Myocardial Cells
- Heavy labor cells
- Constantly contracting relaxinggt delivering
blood to the periphery - Contain contractile proteinsgt actin myosin
- Depolarizationgtmyocardial cellgtcalcium released
within cellgtcontract
8
Time Voltage
- Waves on EKG primarily reflect electrical
activitygtmyocardial cells - Waves-3 characteristics
- 1. Duration-measured fraction/second
- 2. Amplitude-measured millivolts (mV)
- 3. Configuration-shape/appearance
9
EKG PAPER
- Light lines small squares- 1 X 1 mm
- Bold lines large squares 5 X 5 mm
- Horizontal axistime
- 1. Distance across small square0.04 sec.
- 2. Distance across large square0.2 sec.
- Vertical axisvoltage
- 1. Distance across small square0.1 mV
- 2. Distance across large square0.5 mV
- 6 second strip to figure rate (X 10) (30 lg6)
10
SINUS NODE
- STARTS EACH CARDIAC CYCLE OF CONTRACTION
RELAXATION BY SPONTANEOUS DEPOLARIZATION THIS IS
NOT SEEN ON THE EKG
11
ATRIOVENTRICULAR (AV) NODE
- Electrical Gatekeeper between atria and
ventricles - Allows atrial contraction to end empty contents
into the ventricle before ventricular contraction
begins
12
VENTRICULAR DEPOLARIZATION
- WAVE DEPOLARIZATION SPREADS THROUGH THE 3
PARTS-Bundle of His (intrinsic 40-60 bpm)gt Bundle
Branchesgt Purkinje Fibers (intrinsic 20-40 bpm)
out into the ventricular myocardium - Beginning ventricular depolarizationgtQRS complex
13
VENTRICULAR REPOLARIZATION
- Brief refractory period
- Restore electro negativity of their interiors
- T wave
- Atrial repolarization is not seen
14
PR INTERVAL
- Includes P wave the first straight line
connecting it to the QRS interval - Measures the time from the start of atrial
depolarization to the start of ventricular
depolarization - Normal 0.12-0.20 sec
- gt0.20 delay in AV conduction
- lt0.12 shortens as HR increases
15
ST SEGMENT
- The straight line connecting the end of the QRS
complex with the beginning of the T wave - Measures the time from the end of ventricular
depolarization to the start of ventricular
depolarization
16
QT INTERVAL
- Includes the QRS complex, ST segment, T wave
- Measures the time from the beginning of
ventricular depolarization to the end of
ventricular repolarization - Normal duration QRS 0.06-0.10 seconds
17
RATE MEASURMENT
- 1. COUNT THE OF QRS COMPLEXES IN 6 SECONDS X
10, MOST COMMON - 2. COUNT OF LG. BOXES BETWEEN 2 R WAVES /BY
300 - 3. COUNT OF SM. BOXES BETWEEN 2 R WAVES /BY
150
18
STEPWISE APPROACH STRIP INTERPRETATION
- A. Determine Atrial Ventricle Rate
- 1. V-measure R-R, A-measure P-P
- 2. gt100 Tachycardia, lt60 Bradycardia
- B. R-R Interval Regular?
- C. P wave Formation
- 1. Precede QRS, occur regularly,
- similar size
- 2. P wave (SA Node) OR -/absent (AV
- Junction)
- D. QRS wide or narrow
19
SINUS NODE DYFUNCTION
- SINUS ARRHYTHMIA
- SINUS TACHYCARDIA
- SINUS BRADYCARDIA
20
SINUS ARRHYTHMIA
- A. Rate 60-100 bpm
- B. R-R irregular
- C. Normal P wave
- D. Normal PR interval 0.12-0.20 sec.
- E. Normal QRS complex lt/0.10 sec.
- Phasic slowing quickening, benign, normal
response to respirations, asymptomatic - Except in elderlygtSick Sinus Syndrome, not
usually seen in infants
21
SINUS BRADYCARDIA
- Usual response to reduced demand for blood flow
- A. Rate lt 60 bpm
- B. R-R Regular
- C. Normal P wave
- D. Normal PR interval
- E. Normal QRS Complex
- Asymptomatic Vs. Symptomatic
22
SINUS TACHYCARDIA
- ACCELERATION SA NODE
- A. Rate gt110 bpm (110-160)
- B. R-R Regular
- C. Normal P wave
- D. Normal PR Interval 0.12-0.20 sec
- E. Normal QRS Complex lt/0.10 sec
- Response to exercise/stress, OR response illness
(hypovolemia/hypotension)gtresolves once cause
fixed
23
ATRIAL DYSRHYTHMIAS
- Most common cardiac rhythm disturbance
- Originate in/around SA Node above ventricle
- Can diminish atrial kick gt20 ventricular
volume - PSVT-Paroxysmal Supraventricular Tachycardia
- Atrial Fibrillation
- Atrial Flutter
24
PSVT
- A. Rate 150-250 bpm
- B. Regular R-R interval
- C. P wave can be buried
- D. PR interval may be hard to find
- E. Normal narrow QRS complex
- Treatment LVEF50gtCCB, BB, Dig., possible
cardioversion, lt40 No Cardioversion!, Dig.,
Amiodorone, Diltiazem
25
ATRIAL FLUTTER
- A. Atrial Rate 250-350 bpm
- B. R-R Irregular
- C. P wave classic saw tooth OR flutter
- D. PR interval immeasurable
- E. QRS complex narrow
- May have palpitations, OR s/sx reduced C.O.
- If symptomaticgtcardioversion, BB, Sotalol, Dig.
26
ATRIAL FIBRILLATION
- Chaotic, asynchronous electrical activity in
atrial tissuegtmultiple impulses numerous eptopic
pacemakers - A. Atrial Rate-indiscernible, V-Rate 60-160
(RVR-Rapid Ventricular Response) - B. R-R Irregular
- C. No P wave
- D. No PR interval
- E. QRS narrow
27
JUNCTIONAL ESCAPE RHYTHM
- Originates in AV junction escape pacemaker
- A. Rate 40-60 bpm
- B. R-R Regular
- C. Inverted P wave, preceding each QRS
- D. PR Interval short 0.10 sec.
- E. QRS normal
- How is patient tolerating? Loss of atrial
kickgt can reduce C.O. by 20
28
PREMATURE BEATS
- Premature Atrial Contractions (PACs)-originate
outside AV node, single/multiple ectopic focus
supersede SA node - Premature Ventricular Contractions
(PVCs)-ectopic beats that originate in
ventricles occur earlier, singles, pairs or in
clusters
29
VENTRICULAR DYSRHYTHMIAS
- VENTRICULAR TACHYCARDIA
- VENTRICULAR FIBRILLATION
30
VENTRICULAR TACHYCARDIA (V-TACH)
- Defined as Vent. Rate gt 100 bpm when 3 OR more
PVCs strike in a row - Life threatening, unstable, sustained OR
unsustained - A. A-rate cant be determined, V-rate100-250
bpm - B. R-R regular or slightly irregular
- C. P wave usually absent, dissociated
- D. PR Interval-immeasurable
- E. WIDE QRS gt0.12 sec. Bizarre appearance
31
VENTRICULAR FIBRILLATION (V-FIB)
- VF-Full cardiac arrest, no pulse/BP, always check
patient firstgtDefibrillategtCPR/ACLS - A. Rate-cant be determined pulseless
- B. R-R cant determine
- C. P wave cant be determined
- D. PR interval cant be determined
- E. QRS complex cant be determined
- Ventricular electrical activity gtfibrillatory
waves with no recognizable pattern
32
A-V BLOCKS
- Interruption/delay in the conduction of
electrical impulses between the atria
ventricles - Classified site of block/severity of conduction
abnormality - 1st degree, 2nd degree Mobitz I (Wenkebach), 2nd
degree Mobitz II, 3rd degree (Complete heart
block)
33
1st Degree AV Block
- Characterized by PR Interval gt 0.20 seconds
- Delay in conduction AV Node
- Prolonged PR Interval constant
- Usually asymptomatic
- Least concerning of the blocks
34
2nd Degree Mobitz I (Wenkebach)
- Successive impulses from SA node delayed slightly
longer than the previous impulse - Characterized by prolonged PR interval that
continues until the P wave is dropped (impulse
doesnt reach ventricle) - May have hypotension or lightheadedness
35
2nd Degree Mobitz II
- Less common, more serious
- Impulses from SA node fail to conduct to
ventricles - Hallmark PR Interval constant normal or
prolonged, doesnt prolong before dropping, not
followed by QRS, can have gt 1 dropped in a row - Precursor to 3rd Degree Heart Block
36
3RD DEGREE COMPLETE HEART BLOCK
- Indicates complete absence of impulse between the
atria ventricle - Atrial rate gt or ventricular rate
- Occur _at_ AV node 40-60 bpm
- Occur _at_ bundle branches lt 40 bpm wide QRS complex
- Decreased C.O., P-P R-R disassociated
37
EKG INTERPRETATION
- LETS PRACTICE!!!!
Recommended
CrystalGraphics Presentations