
Regression with Panel Data SW Chapter 10 - PowerPoint PPT Presentation
1 / 75
Title:
Regression with Panel Data SW Chapter 10
Description:
The Fixed Effects Regression Assumptions and Standard Errors for Fixed Effects ... Case II: uit and uis are correlated so Assumption 5 fails. 50 ... – PowerPoint PPT presentation
Number of Views:73
Avg rating:3.0/5.0
Title: Regression with Panel Data SW Chapter 10
1
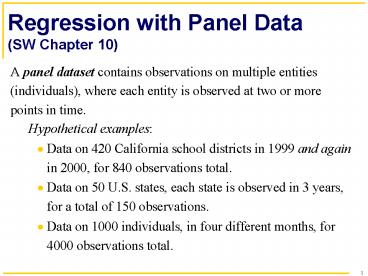
Regression with Panel Data(SW Chapter 10)
2
Notation for panel data
3
Panel data notation, ctd.
4
Why are panel data useful?
5
Example of a panel data setTraffic deaths and
alcohol taxes
6
U.S. traffic death data for 1982
7
U.S. traffic death data for 1988
8
Why might there be more traffic deaths in states
that have higher alcohol taxes?
9
Example 1 Traffic Density
10
Example 2 cultural attitudes towards drinking
and driving
11
Panel Data with Two Time Periods(SW Section
10.2)
12
(No Transcript)
13
(No Transcript)
14
Example Traffic deaths and beer taxes
15
?FatalityRate v. ?BeerTax
16
Fixed Effects Regression(SW Section 10.3)
17
(No Transcript)
18
(No Transcript)
19
The regression lines for each state in a picture
20
(No Transcript)
21
Summary Two ways to write the fixed effects
model n-1 binary regressor form
22
Fixed Effects Regression Estimation
23
1. n-1 binary regressors OLS regression
24
2. Entity-demeaned OLS regression
25
Entity-demeaned OLS regression, ctd.
26
Entity-demeaned OLS regression, ctd.
27
Example Traffic deaths and beer taxes in STATA
28
Example, ctd. For n 48, T 7
29
By the way how much do beer taxes vary?
30
(No Transcript)
31
(No Transcript)
32
Regression with Time Fixed Effects(SW Section
10.4)
33
Time fixed effects only
34
Two formulations for time fixed effects
35
Time fixed effects estimation methods
36
(No Transcript)
37
Combined entity and time fixed effects
38
The Fixed Effects Regression Assumptions and
Standard Errors for Fixed Effects Regression (SW
Section 10.5 and App. 10.2)
39
A. Extension of LS Assumptions to Panel Data
40
Assumption 1 E(uitXi1,,XiT,?i) 0
41
Assumption 2 (Xi1,,XiT,Yi1,,YiT), i 1,,n,
are i.i.d. draws from their joint distribution.
42
Assumption 5 corr(uit,uisXit,Xis,?i) 0 for
t ? s
43
Assumption 5 in a picture
44
What if Assumption 5 fails so
corr(uit,uisXit,Xis,?i) ?0?
45
B. Standard Errors
46
Sampling distribution of fixed effects estimator,
ctd.
47
Sampling distribution of fixed effects estimator,
ctd.
48
Case I when uit, uis are uncorrelated
49
Case II uit and uis are correlated so
Assumption 5 fails
50
Case II Clustered Standard Errors
51
Comments on clustered standard errors
52
Comments on clustered standard errors, ctd.
53
Comments on clustered standard errors, ctd.
54
Implementation in STATA
55
Case II treat uit and uis as possibly correlated
56
Try adding year effects
57
(No Transcript)
58
Fixed Effects Regression ResultsDependent
variable Fatality rate
59
Summary SEs for Panel Data in a picture
60
Application Drunk Driving Laws and Traffic
Deaths (SW Section 10.6)
61
Drunk driving laws and traffic deaths, ctd.
62
(No Transcript)
63
(No Transcript)
64
(No Transcript)
65
(No Transcript)
66
(No Transcript)
67
(No Transcript)
68
The drunk driving panel data set
69
Why might panel data help?
70
(No Transcript)
71
(No Transcript)
72
Empirical Analysis Main Results
73
Digression extensions of the n-1 binary
regressor idea
74
Summary Regression with Panel Data (SW Section
10.7)
75
(No Transcript)