
Biomass Mapping - PowerPoint PPT Presentation
Title: Biomass Mapping
1
Integration of GLAS Height Product and MODIS
Observations for Biomass Mapping and Validation
in Central Africa
The Woods Hole Research Center
Alessandro Baccini, Scott J. Goetz, Mindy Sun,
and Nadine Laporte The Woods Hole Research
Center, Falmouth, MA
Contacts abaccini_at_whrc.org
Biomass Mapping The set of field biomass training
data and the MODIS observations were used to
develop a regression tree model (Random Forest).
Biomass predictions for the entire area were then
generated by incorporating reflectance
measurements from the first seven MODIS spectral
bands (the land bands) into the regression tree
model, effectively extending the model based on
field training data to the entire region.
Abstract Observations from the Moderate
Resolution Imaging Spectroradiometer (MODIS) were
used in combination with a large data set of
field measurements in a tree-based model to map
woody above-ground biomass (AGB) across tropical
Africa. Analysis of lidar metrics from the
Geoscience Laser Altimetry System (GLAS), which
are sensitive to vegetation structure, were used
to validate the biomass estimates and to
investigate the relationship between lidar
metrics and above-ground biomass. The results
indicate that the model successfully stratified
the landscape across the full range of biomass
classes. The results also showed a strong
positive correlation between the GLAS height of
median energy and predicted AGB.
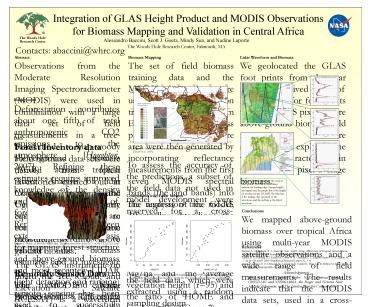
Lidar Waveform and Biomass We geolocated the GLAS
foot prints from the year 2003 and derived a set
of lidar metrics for foot prints within MODIS
pixels where above-ground biomass field
measurements were available. We explored the
waveform characteristics in relation to the pixel
average biomass.
Background
Deforestation contributes about one fifth of
total anthropogenic CO2 emissions to the
atmosphere Houghton, 2007. Refining these
estimates requires improved knowledge of the
density and spatial distribution of forest
biomass. Remote sensing has been extensively used
as a basis for mapping forest structure and
above-ground biomass and most recentely LIDAR
(light detection and ranging) remote sensing has
been used to successfully characterize vegetation
vertical structure and height, and to infer AGB
Lefsky et al., 2005 Drake et al., 2002.
Data
Forest Inventory data Field biomass data sets
were derived from forest inventories carried out
in Congo, Cameroon, and Uganda. Allometric
equations were used to convert timber volume
measurements into above ground biomass. Remotely
Sensed Data The MODIS Nadir Bidirectional
Reflectance Distribution Function (BRDF) adjusted
reflectances (NBAR) product (MOD43B4.V4) provides
surface reflectances at 1 km spatial resolution
and composited 16 day temporal resolution. The
study uses seven bands designed for land
applications with wavelength from 459 to 2155 nm.
We analyzed ten 16-day products of NBAR data for
each year between 2000 and 2003, and developed a
mosaic of best quality observations.
Figure 2. Above ground biomass derived from
MODIS data and field measurements Baccini et
al., 2008.
To assess the accuracy of the predictions, a
subset of the field data not used in model
development were reserved for a cross-validation
analysis. Following common protocol for
data-intensive regression tree models, we used
10 (154 samples) of the field data, which were
extracted using a random sampling design . The
Random Forest model estimated using MODIS
spectral reflectance proved effective for
predicting above ground biomass (Fig. 2). The
tree model explained 82 of the variance in
above-ground biomass density, with a root mean
square error (RMSE) of 50.5 Mg/ha.
The plots on the right show the vertical lidar
profile. The black dotted lines indicate the
leading edge (canopy height) and signal end, the
purple line is the height of median energy
(HOME), the blue line is the trailing edge
(ground) of the waveform, and the red line is the
fitted waveform.
Comparison with Lidar Metrics The analysis of the
GLAS data showed a strong positive relationship
between Random Forest predicted biomass
aggregated in classes of 10 Mg/ha and the average
vegetation height (r95) and the ratio of HOME
and height (r95) (Figure 2).
Conclusions We mapped above-ground biomass over
tropical Africa using multi-year MODIS satellite
observations and a wide range of field
measurements. The results indicate that the MODIS
data sets, used in a cross-calibrated regression
tree model, captured the amount and spatial
distribution of above-ground biomass across
tropical Africa. Comparison with GLAS LIDAR
height metrics, showed strong positive
correlations with the mapped MODIS biomass
density values. We are now conducting analyses
using MODIS and GLAS data fusion.
Figure 1. Mosaic of MODIS NBAR data. The black
dots show about 30 of the GLAS L2A (year 2003)
shots after screening procedure and used in the
comparison analysis with the predicted biomass.
References Baccini A., N. Laporte, S. J. Goetz,
M. Sun, and H. Dong. A first map of Tropical
Africas above-ground biomass derived from
satellite imagery, (forthcoming, 2008). Lefsky M
A, Harding D J, Keller M, Cohen W B, Carabajal C
C, Espirito-Santo F D B, Hunter M O de Oliveira
R 2005 Geophysical Research Letters 32,
14. Drake B J, Knox R G, Dubayah R O, Clark D B,
Condit R, Blair J B Hofton M 2003 Global
Ecology and Biogeography 12, 147159.
The GLAS instrument on board the Ice, Cloud, and
Elevation Satellite (ICESAT) is a waveform
sampling lidar sensor designed for global
observation of the Earth. Lidar metrics have been
extensively used to characterize vegetation
structure. In this work we used about 1.3 million
observations recorded from GLAS Laser 2 (L2A)
between Oct-Nov 2003 (Figure 1), including the
average vegetation height and the height of
median energy (HOME) variables.
Acknowledgements This work was funded under NASA
contract number G05GD14G and NNS06AA06A, the
Roger and Victoria Sant, Joseph Gleberman, and
The Linden Trust for Conservation
Figure 2. Relationship between GLAS derived
height, ratio of HOME and height and predicted
biomass (Mg/ha) aggregated in classes of 10
Mg/ha. The horizontal bars show the standard
error for the GLAS metric within biomass bin.
Recommended
CrystalGraphics Presentations


