
Outline of talk for Snowmass - PowerPoint PPT Presentation
1 / 4
Title:
Outline of talk for Snowmass
Description:
comparison of long-barrel (LDC) with short-barrel endcaps (SiD) vtx det ... for the gold-plated cases, in which b-quarks hadronise to B ... – PowerPoint PPT presentation
Number of Views:20
Avg rating:3.0/5.0
Title: Outline of talk for Snowmass
1
Outline of talk for Snowmass
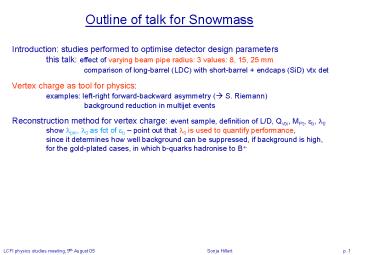
Introduction studies performed to optimise
detector design parameters this talk effect of
varying beam pipe radius 3 values 8, 15, 25
mm comparison of long-barrel
(LDC) with short-barrel endcaps (SiD) vtx
det Vertex charge as tool for physics
examples left-right forward-backward asymmetry
(? S. Riemann) background reduction in
multijet events Reconstruction method for vertex
charge event sample, definition of L/D, Qvtx,
MPt, eb, l0 show lpm, l0 as fct of eb point
out that l0 is used to quantify
performance, since it determines how well
background can be suppressed, if background is
high, for the gold-plated cases, in which
b-quarks hadronise to B-
2
Effect of varying CM energy at low sqrt(s)
average track momentum lower (mult
scattering!) seed vertex closer to IP (plots
of Ldec vs sqrt(s), l0 vs Ldec percentages of
vertices in beam pipe and between vtx det.
layers at different energies (50 .. 500 GeV)) ?
Qvtx reconstruction more challenging at lower
energies Polar angular dependence plot l0 vs
cos q at 4 energies (see last Phys. Mtg), for
standard detector poorer performance at low
sqrt(s) large cos q , as expected Varying the
beam pipe radius introduction with schematics of
the 3 detectors compared, point out that beam
pipe needs to be thicker if its radius is larger,
for mech. integrity plot of l0 vs (L/D)min,
cut values chosen for the 3 detectors (0.17,
0.18, 0.19) plot l0 vs cos q comparing the
performance of the 3 dets at sqrt(s) 100
GeV l0 increases from 9.5 to 12.5 when
going from standard to large Rbp vtx detector,
in a typical cos q bin (0.2 lt cos q lt 0.25)
3
Plots summarising Rbp comparison l0 vs sqrt(s)
in 2 bins of cos q (0.2, 0.25), (0.85,
0.9), in central part of det, difference
standard large Rbp det more pronounced, at the
edge, difference between standard and small Rbp
det is larger l0 vs sqrt(s) averaged over 0 lt
cos q lt 0.9 (relevant for multijet
processes) at lower energies, difference
between detectors is larger Translating l0
values into effective luminosity introduce n-jet
luminosity factor, quantifying how much more
integrated luminosity the detectors with changed
Rbp would need compared to the standard
detector (small radius det yielding factor below
1) obtained from increasing Ldec cut until l0
of less good detector agrees with that of
better detector in practise, one would use
events with lower Ldec with reduced weight
would expect weight to be close to 0 if
background gtgt signal plots of 2- and 4-jet
luminosity factors, at sqrt(s) 100 GeV (
possibly 50, 500 GeV, if time permits values
for those energies currently in preparation) at
100 GeV, factors are 1.6 (Rbp 25mm) and 0.7
(Rbp 8 mm), respectively
4
Comparison with SiD detector SiD short-barrel
endcaps vertex detector, inserted into the same
global detector geometry used for LDC detector
(TESLA geometry) plots of l0 vs cos q at sqrt(s)
100 GeV and energy dependence of cos q average
(as for Rbp comparison) results still in
preparation plot to determine L/D cut showed
overall performance very similar to standard
det., comparison in terms of cos q dependence in
preparation
Recommended
CrystalGraphics Presentations


