
Expected Value Decision Making: - PowerPoint PPT Presentation
1 / 29
Title:
Expected Value Decision Making:
Description:
The length of patient's life after either treatment is unpredictable. ... 10 Wheal chair-bound 3 (the outcome if a second surgery is necessary. 0 Death 0. 12 ... – PowerPoint PPT presentation
Number of Views:71
Avg rating:3.0/5.0
Title: Expected Value Decision Making:
1
- Expected Value Decision Making
- Medical decision-making problems often can not
be solved by reasoning based on patho-physiology.
Clinicians need a method for choosing among
treatments when the outcome of a treatment is
unpredictable, as are the results of a surgical
procedure. - Let us consider the following example
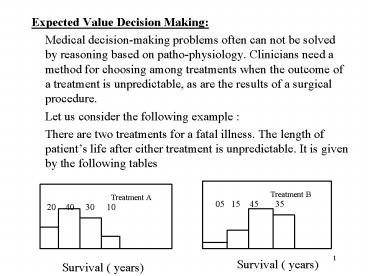
- There are two treatments for a fatal illness.
The length of patients life after either
treatment is unpredictable. It is given by the
following tables
Treatment B
Treatment A
05 15 45 35
20 40 30 10
Survival ( years)
Survival ( years)
2
- Each treatment is associated with uncertainty.
Regardless the treatment, the patient will die
after 4 years. There is no way to know which year
will be his last - Which treatment is preferable?
- A choice among treatments is choice among
gambles. - How should you choose among the gambles?
- We shall propose a method for choosing- called as
expected value decision making Characterize
each gamble by one number and use this number to
compare gambles.
3
- The ideal criterion for choosing a gamble should
be a number that reflects preference for the
outcomes of the gamble. - Utility number is the name given to a measure of
preference that has a desirable property for
decision making. - The gamble with the highest utility value should
be preferred - We can perform this calculation for both
treatments. - The mean survival rate for treatment A 1 x
0.22 x 0.43 x 0.34 x 0.1 2.3 years. - Similarly, for treatment B it will be 3.1 years
- If the length of life is our decision, treatment
B should be selected. - Representing Choices with Decision Tree
- The choice between treatments A and B is
represented diagrammatically in the Figure.
Events that are under control of a chance node
are represented by a chance node ( circle). Each
line represents an outcome.
4
- Associated with each line is the probability of
the outcome occurring. We can calculate the mean
survival for the chance node. The average length
of life is called expected survival.
p 0.05
p 0.20
Survival 1 year
Survival 1 year
p 0.40
p 0.15
Survival 2 years
Survival 2 years
p 0.45
Exp value 3.1 years
p 0.30
Survival 3 years
Exp value 2.3 years
Survival 3 years
p 0.35
p 0.10
Survival 4 years
Survival 4 years
Treatment B
Treatment A
A chance node representation for survival rates
for two possible treatments
5
- To use expected value of decision making. We
follow this strategy when there are treatment
choices with uncertain outcomes. - 1. Calculate the expected value of each decision
alternatives, then - 2. Pick the alternative with the highest expected
value. - Performing the Decision Analysis
- We extend the concept of expected-value of
decision making by introducing the concept of
decision analysis. There are four major steps in
the decision analysis - 1. Create a decision tree this step is the most
difficult, because it requires formulating the
decision problem, assigning probabilities, and
measuring the outcomes. - 2. Calculate the expected value of each decision
alternative. - 3. Choose the decision alternative with the
highest expected value. - 4. Use sensitivity analysis to test the
conclusions of the analysis.
6
- Many health professionals balk when they learn
about the technique of decision analysis, because
they recognize the possibility of errors in
assigning values to both the probabilities and
the utilities in a decision tree. - The first step in the decision analysis is to
create a decision tree that represents the
decision problem. Consider the following decision
problem - The patient is Mr. Danby, 66-years old, who is
crippled with arthritis of both knees severe
enough for free movement. In addition to it he
has emphysema, a disease in which lungs lose
their ability to exchange oxygen and CO2. He is
considering knee-replacement surgery - In the surgery there is a risk he may not survive
the operation. - Possible outcomes could be death from the
infection, death from procedure, poor mobility
and full recovery.
7
Operative death
Operative death
Surgery
Infection
Survival
Full mobility
Survival
No infection
Poor mobility
No Surgery
Decision tree for knee- replacement surgery. The
square represents the decision node and circle
represent chance nodes
8
- Mr. Danbys internist is familiar with the
decision analysis. Using the conventions of the
decision analysis, the internist sketches the
decision tree. Square box denote the decision
node and lines from the decision nodes represent
actions. - p( full recovery after the surgery ) 0.6,
- p( partial recovery after the surgery) 0.4.
- p( operative death) 0.05, p(survival )
0.95 - p( post-surgery infection) 0.05, p(no
infection) 0.95 - These probabilities could be very subjective at
times. - For the decision analysis to work, you have to
assign utility values for the each outcome. - The possible outcomes are
- Full mobility, Poor mobility ( if infection
develops after the operation - Wheel chair bound Death
9
- It is important that assessment of utilities is
done properly. - Assessment of Utilities
- It is more complex than assigning probabilities.
For some therapies, these values may be
available. However, there are some outcomes, such
as physical and mental disabilities, prolonged
hospitalization, pains and death for which it is
difficult to assign utility values. - You have to assign reasonable utility values for
all of these. - All the positive and negative aspects of the
outcomes must be considered in assessment of the
utility values. - Proper units have to be developed to consider the
degree of pains, adverse drug reactions and
death.
10
- Though, the assessment of probabilities is
exclusive responsibility of physicians, the
assessment of utilities must be done in
cooperation with the patient and his family.
Some individual may take higher risks to return
to normal life. - The main advantage of the decision analysis is
that construction of decision tree alone forces
the physician to think of various outcomes in
the diagnosis, which is often ignored
anticipating all the possible outcomes of a given
condition. - In clinical studies, where formal construction of
tree appears warranted, some methods are
available for simplifying the tree and
calculations. Some of the tree branches can be
pruned without any significant problems.
11
- Outcome for the surgery
- Survival Years of full function
- (years) Functional status equivalent to
outcome - 10 Full mobility 10
- ( successful surgery)
- 10 Poor mobility 6
- ( status quo or unsuccessful surgery)
- 10 Wheal chair-bound 3
- (the outcome if a second surgery is necessary
- 0 Death 0
12
(No Transcript)
13
- The following calculations are performed for node
A - 1. Calculate the expected value of operative
death after the surgery ( prosthesis). Multiply
this by utility factor ( 0.05 x 0 0 ) - 2. Calculate the expected value of surviving
surgery(prosthesis) 3 x 0.95 2.85 - 3. Add the expected value calculated in steps 1
and 2 to obtain the expected of developing
infection 0 2.85 2.85. - Perform the similar calculations for node B ( 0.6
x 10 0.4 x 6) 8.4 - Obtain the expected value of surviving
knee-replacement surgery ( node C ) as follows - 1. Multiply the expected value of infected
prosthesis by the by the value of probability of
infection 2.85 x 0.05 0.143 - 2. Multiply the expected value of no infection by
the probability of no infection 0.95 x 8.4
7.98
14
- 3. Add the expected value calculated in steps 1
and 2 , which gives 0.143 7.98 8.123. - Perform the expected value of chance node, by
the same procedure for the node D ( 8.135 x 0.95
0 x 0.05 7.7 ). - The conclusion
- For surgery, Mr Danby average life expectancy,
measured in terms of normal mobility is 7.7 .
This does not mean Mr. Danby is guaranteed 7.7
years of mobile life by accepting the surgery. - However, it means that if the physician had 100
similar patients who underwent the surgery, the
average number of mobile years would be 7.7 years - However, by accepting no surgery, the average
length of life ( equivalent to full mobility )
will be 6 years. Some patients may live longer,
and some shorter. - This is the principle of the decision analysis.
15
- Performing Sensitivity Analysis
- Sensitivity analysis is a test of validity of the
conclusions of the analysis over a wide range of
assumptions about the probabilities and values of
utilities. - There is often a wide range of reasonable
probabilities that a physician could use with
equal confidence. - The sensitivity analysis is used to answer this
question - Do my conclusions regarding the preferred choice
change when the probability and outcome estimates
are assigned values that lie in a reasonable
range? - To come up with a satisfactory answer to this
question, the decision analysis is performed for
a reasonable probabilities (range)and outcome
ranges and the expected value of decisions are
examined in the light of various outcomes. - The appropriate action is taken.
- The sensitivity value should be small.
16
- .
Expected Years of Healthy Life
25 is threshold
17
- .
Expected Years of Healthy Life
20 is threshold
18
- Sensitivity Analysis
- Data from clinical studies often represent only
an approximation of the probability of a given
outcome. - Therefore, it is essential to study the effects
of changing some of the probabilities. - If the decision proves to be very sensitive to
one or more of the values substituted, an
additional data gathering or more careful
consideration of existing such data may be
necessary. - Unfortunately, the sensitivity analysis is very
tedious. If you have to test a large number of
probabilities and utilities. - However, there are standard computer based
techniques available which can automatically
identify sensitive variables and flag them. To
obtain any meaningful results, we have to ensure
that all the sensitive variables are estimated
very carefully.
19
- Treat, Test or Do Nothing?
- The physician who faces a diagnostic challenge
and has evaluated one patients symptoms. He must
then choose among the following actions - 1. Do nothing further ( neither perform
additional tests nor treat the patient. - 2. Obtain additional diagnostic information
(test) before choosing whether to treat. - 3. Treat without waiting for more information.
- This decision is simplified when the physician
knows the true state of the patient and the
further testing is unnecessary. At this stage the
doctor needs only to assess the tradeoffs among
various therapeutic actions. - Deciding among treating, testing, and doing
nothing sounds difficult, but you have learnt the
principles to solve this kind of problem. There
are three steps
20
- 1. Determine the treatment-threshold probability
- 2. Determine the pre-test probability of the
disease. - 3. Decide whether a test result could affect
affect your decision to treat. - The treatment-threshold probability is the
probability of the disease at which you are
indifferent between treating and not treating.
Above the threshold, you should treat. - Do not order a test unless it could change the
management of your patient. - Example
- Your patient has a possible blood clot in the
vessels of lungs (plumonary embolus). You have
assigned the pretest probability as 0.05 and the
treatment threshold is 0.10. - If you obtain no further information, you would
treat the patient if the pretest probability was
above 0.10
21
- You decide whether a positive lung scan would
raise the probability of the disease to above the
threshold level(0.10) - You have reviewed the literature and learnt the
true positive rate of the lung scan is 0.75 and
the false positive rate of 0.25. - A negative test scan would decrease the posttest
probability below threshold. A positive test will
move the probability towards the threshold and
could alter your decision to treat the patient. - You therefore use Bayes theorem to calculate the
posttest probability before ordering the test.
22
- Decision Analysis ( Further examples)
- Let us first consider a non clinical example to
show the application of the decision analysis. - Example
- The quarterbacks team has the possession of the
ball on the 18th yard line of his opponent and
with one minute left in the game and his team
trails by 4 points. It is fourth down, with 5
yards to go for a first down. - Analysis
- The choices are to pass, kick a field goal, or
attempt a running play. Before the quarterback
can decide which choice to make, he must know
what the outcome choices may be. A decision tree
representing the choices and possible outcome has
to be constructed. - At the square node, the choice is in the hand of
decision maker and at the circular node, the
outcome is dictated by a chance.
23
- Next, the quarterback must assess the likelihood
of each outcome. The probabilities are indicated. - In order to obtain some index of the worth of
each outcome, utility values are to be assigned. - Is should be apparent that the relative worth of
each of the alternate course of action is
function of both the probability of the outcome
and the value of the utility. - Even though the probability of the field goal is
0.9, its value is limited, because it generates
only 3 points and fails to win the game. - The best choice is the one with highest expected
value of the event. - The highest value is 350 units, and corresponds
to a complete pass.
24
0.48
0.06
0.03
0.03
25
(No Transcript)
26
350
133.2
0.48
0.03
18.0
0.90
0.02
94.2
0.15
-25
0.78
0.03
0.02
27
- Example of Decision Theory in a clinical problem
- A 24 year-old women had both her kidneys removed
and she received a kidney transplant. A
splenectomy was carried out to correct
leukopenia. Recently she is admitted to hospital
with many complications. The diagnosis of
subdiaphragmatic abscess was considered at this
time, and the possibility of surgery is
considered (suspected of having subphrenic
abscess). The decision tree is shown in the
figure. - The choices are - either to operate or not to
operate and the consequences of both choices are
to be described explicitly with all the
probabilities - The expected value of the surgery is 62.5 units
and that of no surgery is 81.1 unit. - Since the expected value of no surgery exceeds
the expected value of the surgery, the best
solution is that to treat the patient medically.
28
(No Transcript)
29
89.2
36.8
59.8
60.6
21.3
62.5
63.8
37.0
81.1
0.30
0.55
0.70
Recommended
CrystalGraphics Presentations


