
Photos:%20K.%20Frey,%20B.%20Kiel,%20L.%20Mertes - PowerPoint PPT Presentation
Title:
Photos:%20K.%20Frey,%20B.%20Kiel,%20L.%20Mertes
Description:
Photos: K' Frey, B' Kiel, L' Mertes – PowerPoint PPT presentation
Number of Views:51
Avg rating:3.0/5.0
Title: Photos:%20K.%20Frey,%20B.%20Kiel,%20L.%20Mertes
1
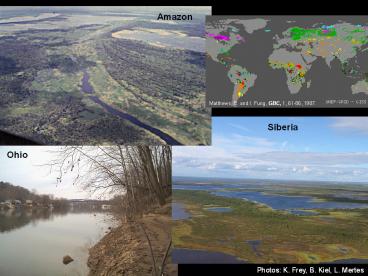
Amazon
Matthews, E. and I. Fung, GBC, 1, 61-86, 1987.
Siberia
Ohio
Photos K. Frey, B. Kiel, L. Mertes
2
Overview of Hydrology Objectives and Requirements
- Doug Alsdorf and the Virtual Mission Team
Kostas Andreadis, Paul Bates, Sylvain
Biancamaria, Mike Durand, Hyongki Lee, Dennis
Lettenmaier, Delwyn Moller, Nelly Mognard,
Ernesto Rodriguez, C.K. Shum
Funding from CNES, JPL, NASAs Terrestrial
Hydrology and Physical Oceanography Programs,
and the Ohio State Universitys Climate, Water,
Carbon Program
3
Outline
- Hydrology Science Objectives
- Hydrology Measurement Requirements
- What we know
- What we need to know
4
Hydrology Science Questions
- Water Cycle What is the spatial and temporal
variability in the world's terrestrial surface
water storage and discharge. How can we predict
these variations more accurately? - Floodplains Wetlands How much water is stored
on a floodplain and subsequently exchanged with
its main channel? How much carbon is potentially
released from inundated areas? - Society What are the policy implications that
freely available water storage data would have
for water management? Can health issues related
to waterborne diseases be predicted through
better mappings?
5
What we know Global Perspective
Present measurements do not provide needed global
coverage, but a swath altimeter blankets the
globe.
- Profiling Altimeter (16-day repeat)
- About half of worlds rivers sampled only once or
not at all, no slope thus no river discharge. - Swath Interferometer (16-day repeat)
- Swath provides h, ?h/?x, ?h/?t, and area in one
overpass, thus ability to estimate discharge.
Alsdorf, D., E. Rodriguez, and D. Lettenmaier,
Measuring surface water from space, Reviews of
Geophysics, 2007.
6
Orbits
60N
- 74N is OK
- 66N is not
70N
75N
Mackenzie R.
Lena R.
Yenisey R.
75S
Ob R.
7
What we know Local Scale
Water flow across wetlands is far more complex
than implied by GRACE, altimetry, in-situ, or any
other measurement or model. Flow paths and water
sources are not fixed in space and time, rather
vary with flood water elevations. Thus, spatial
sampling needs to be dense with small pixel sizes
and temporally repeated samplings. If you need
more precise measure-ments of natural events on
Earth's surface, get into space. Nature
Image shows dh/dt from JERS-1 InSAR, but method
works only in flooded forests where the radar
pulse has a double-bounce travel path.
8
Measurements Required h, ?h/?x, ?h/?t, and area,
globally, on a weekly basis
9
There are hundreds of thousands of reservoirs and
lakes around the world, but their storage changes
are poorly known. The change in elevations (blue
dots compared to red dots) agree with the height
of the dam, but the elevation standard deviation
for each height measurement is too large. KaRIN
will improve this by an order of magnitude, but
the SRTM data suggest a great opportunity for a
future satellite mission.
s 5.71m
s 7.41m
Hoover Reservoir, Columbus Ohio
Kiel, Alsdorf, LeFavour, PE RS, 2006
10
What we know Discharge
River channel width can be automatically measured
in any satellite based image.
SRTM DEM
Simple equation of water flow demonstrates need
to measure width (w), depth (z), slope (dh/dx),
and friction coefficient (n). Z and n will come
from data assimilation.
Large Width to Depth Rivers
Pavelsky Smith, RivWidth, IEEE GRSL, 2008
11
RivWidth of Ohio River Basin
Courtesy J. Partsch
12
Channel Slope and Amazon Q from SRTM
Water Slope from SRTM
Q m3/s Observed SRTM Error Tupe 63100 62900 -0.3
Itapeua 74200 79800 7.6 Manacapuru 90500 84900 -6
.2
Channel Geometry from SAR
Bathymetry from In-Situ
Mannings n method
LeFavour and Alsdorf, GRL, 2005
13
Ohio River Discharge from the Space Shuttle
Kiel et al., AGU 2006
Cairo, IL
Ohioview, PA
SRTM Elevations of water surfaces can be
converted to river flow using Mannings equation
which relates water slope to flow velocity.
14
What we need to know Global Perspective
How often do these and other rivers and wetlands
need to be sampled in order to know the
terrestrial surface water portion of the water
cycle?
Amazon
Siberia
Ohio
Answers are underway via a Virtual Mission
study.
- Virtual Mission Will define
- the required smallest water body needed to be
measured - the cost and science trade-offs associated with
various orbits and pixel sizes - how to estimate discharge, even where depth
cannot be measured
15
What we need to know Local Scale
What is the spatial and temporal sampling
required to estimate discharge in river channels?
- Are 100 m pixels, with 1 m height accuracies,
every 30 days sufficient to accurately reproduce
the discharge regime of a given river? - Or, are 10 m pixels, with 10 cm heights, every 3
days required? - What are the cost trade-offs?
Data assimilation of synthetic, but realistic,
rivers is providing the answers
- Small 50 km upstream reach of Ohio River
- A hydrodynamic model, provides spatial and
temporal simulation domain
- A water energy balance model, VIC, provides
input for truth simulation - Perturbing precipitation with VIC provides input
to LISFLOOD for open-loop and filter simulations - KaRIN measurements simulated by corrupting
LISFLOOD truth water surface heights with
expected instrument errors
Andreadis et al., GRL, 2007
16
Sensitivity to Satellite Overpass Frequency
- Discharge errors at downstream end, relative to
truth - 8 day 10.0, 16 day 12.1, 32 day 16.9
1000
1000
1000
800
Discharge (m3/s)?
600
400
200
Jun 15
Apr 1
Apr 15
May 1
May 15
Jun 1
Andreadis et al., GRL, 2007
17
Virtual Mission Bathymetric Slope Sensitivity
- SWOT can measure inundated area and total storage
on floodplains. - Knowing these through time, allows selection of
correct channel bathymetric slope. - Errors are being assessed through data
assimilation.
Slide Mike Durand
18
Conclusions
- SWOT is an international collaboration of surface
water hydrology and physical oceanography,
including CNES, NASA, JPL, and many institutes. - Conventional altimetry has large coverage gaps,
but demonstrates ability of radar to measure
heights. - SRTM demonstrates capability to measure surface
water elevations and slopes, despite large
look-angles (gt30º) - Data assimilation shows great promise for
estimating discharge along entire reaches and at
various time intervals. - All are welcome to join us! bprc.osu.edu/water
19
Additional Slides
20
Assimilation Results Ohio River Channel Discharge
Discharge along the channel, April 13, 1995.
Data assimilation of the synthetic KaRIN
measurements clearly improves the discharge
estimate compared to the open loop simulation.
1400
Discharge time series at downstream edge.
Discharge errors relative to truth Open Loop
23.2 8 day DA 10.0 16 day DA
12.1 32 day DA 16.9
1200
1000
800
Discharge (m3/s)?
600
400
200
Apr 1
Apr 15
May 15
Jun 1
Jun 15
Andreadis et al., GRL, 2007
May 1
21
SWOT is Not Gauging from Space
OSTP 2004 Does the United States have enough
water? We do not know. What should we do? Use
modern science and technology to determine how
much water is currently available
Gauges provide daily sampling, which cannot be
matched by a single satellite.
Amazon 6 M km2, 175,000 m3/s U.S. 7.9 M km2,
Mississippi 17,500 m3/s
Birkett, C.M., L.A.K. Mertes, T. Dunne, M.H.
Costa, and M.J. Jasinski,Journal of Geophysical
Research, 107, 2003. Hirsch, R.M., and J.E.
Costa, EOS Transactions AGU, 85, 197-203, 2004.
Alsdorf, Rodriguez, Lettenmaier, Reviews of
Geophysics, 2007.
22
SWOT is Not Gauging from Space
Satellites should be capable of providing dense
spatial coverage. Using a radar altimeter,
16-day repeat, 32 of the rivers and 72 of the
worlds large lakes are not sampled. 120 km wide
swath, 16 day repeat, samples the entire globe
and measures h, dh/dx, and dh/dt.
Topex/POSEIDON 70 points
Amazon 6 M km2, 175,000 m3/s U.S. 7.9 M km2,
Mississippi 17,500 m3/s
Birkett, C.M., L.A.K. Mertes, T. Dunne, M.H.
Costa, and M.J. Jasinski,Journal of Geophysical
Research, 107, 2003. Hirsch, R.M., and J.E.
Costa, EOS Transactions AGU, 85, 197-203, 2004.
Alsdorf, Rodriguez, Lettenmaier, Reviews of
Geophysics, 2007.
23
Purus River SRTM Estimated Discharge
Based on in-situ gauge data, discharge in this
Purus reach is estimated at 8500 m3/s (no
February 2000 data is available, estimate based
on previous years). Slope is assumed constant
because SRTM accuracy is insufficient for finer
resolution. WATER HM will measure expected slope
changes at fine spatial resolution.
24
Required Measurements
Simple, Empirical Mannings Equation
Moderate Continuity Equation
Complex St. Venant Equations continuity and
momentum
( )
1/2
Q
A
h
Q2
( )
z
q -
Vel.
g
x
t
x
t
x
A
?
?
g(S0-Sf)
Assume dA ? w(dz) dz dh
Q
S0 bathymetric slope Sf friction or energy
slope, i.e., dh/dx
Q
h
z ?(h-bathymetry)
q -
w
x
t
h water surface z water depth w channel
width Q (velocity)(z)(w)
q lateral inflow e.g., rain A cross
section
Key All equations depend heavily on knowing the
water surface elevation and its changes.
Recommended
CrystalGraphics Presentations


