Capacity Analysis of Basic Freeway Sections Chapter 12 Continued - PowerPoint PPT Presentation
1 / 20
Title:
Capacity Analysis of Basic Freeway Sections Chapter 12 Continued
Description:
Downgrade is treated like level terrain (grade is 4% or less) c(T)=2000/ET=2000/6=333trucks/hr ... SF-downgrade=4100/.9=4556 vph % trucks = 15 ... – PowerPoint PPT presentation
Number of Views:31
Avg rating:3.0/5.0
Title: Capacity Analysis of Basic Freeway Sections Chapter 12 Continued
1
(No Transcript)
2
(No Transcript)
3
- Capacity Analysis of Basic Freeway Sections
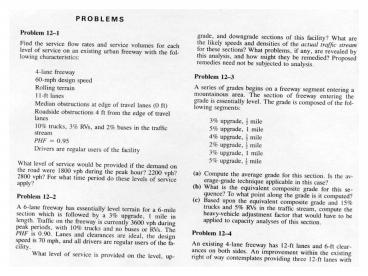
(Chapter 12 Continued) - Problem 12-1
- 4-lane freeway, rolling terrain, 60mph design
speed, 11ft lane with obstructions on both sides
at an average distance2.0 feet - 10 trucks, 3 RV, and 2 Buses
4
- PHF0.95
- c2,000 pcphpl
- v/c1.00(E), .84(D), .69(C), .49(B)
- N2, fw.91 (table 12-3), fp1.00
- ET4, EB3, ERV3 (table 12-5)
- fHV0.71
- SFB2000(.49)(2)(.91)(1)(.71) 1274 vph
5
- SFc2000(.69)(2)(.91)(1)(.71) 1794 vph
- SFD2000(.84)(2)(.91)(1)(.71) 2184 vph
- SFE2000(1.0)(2)(.91)(1)(.71) 2600 vph
- LOS A is not possible for highways with 60 mph
design speed
6
- To convert peak 15-minute flows to peak-hour
flows, multiply by PHF - SVB(1274)(.95)1210 vph
- SVC(1794)(.95)1704 vph
- SVD(2184)(.95)2075 vph
- SVE(2600)(.95)2470 vph
- Comparing these criteria with given demand
volumes - 1,800 vph(D), 2,200 (E), 2,800(F)
7
- Problem 12-2
- Solve the service flow equation for the effective
v/c ratio - v/cSF/(c)(N)(fw) (fp) (fHV)
- fHV1/1.1(5-1).71 for upgrade
- fHV1/1.1(1.7-1).93 for level
- v/c4000/(2000)(3)(1) (1) (.71).93 upgrade,
LOS D - v/c4000/(2000)(3)(1) (1) (.93).71 Level, LOS
C
8
- Densities for LOS CD are 2641
- Adjust. needed to reflect trucks
- 26.10(1.7)D.9(1)D1.07D
- D(level)26/1.0724.03 vpmpl
- 41.10(5)D.9(1)D1.4D
- D(upgrade)41/1.429.3 vpmpl
- FSD, S(level)4000/(24.03)(3)55mph
- S(upgrade)4000/(29.3)(3)46mph
9
- Problem 12-3
- The avge. grade tot. rise/tot. run
- Grade Run Rise
- 0.03 2,640 79.2
- 0.05 5,280 264.0
- 0.04 2,640 105.6
- 0.02 2,640 52.8
- 0.03 5,280 158.4
- 0.05 2,640 136.0
- Total 21,120 792.0
10
- Avge. grade(792/21120)1004
- Part b Figure 12-3, at end of composite grade,
trucks are going at 27 mph,and that is equv. to
4.9 - part c ET7 (15 trucks, 5 grade of 1.5 miles)
- ERV4 (5 RVs)
- fHV1/1.15(7-1).05(4-1)0.49
11
- Problem 12-4
- Improvement of 4-lane with ideal geometric to a
6-lane with less than ideal - c2,000, N2, fw1(ideal), fw.91(3 12ft lanes, 0
ft clearance), fw.89(3 11ft lanes, 1.5ft
clear.), fw.86(3 10ft lanes, 3.0ft clear. ), - ET1.7 EB1.5, fHV0.91, fp1.0
12
- c(exs)2000(1)(2)(1)(1)(.91)3653
- c(12-ft lanes) 4986
- c(11-ft lanes) 4877
- c(10-ft lanes) 4712
- Recommend building the 3 12-ft lanes with no
clearance. This decision is based on capacity.
Safety should be considered.
13
- Problem 12-5
- A design application in rural area with high
truck traffic - The upgrade composite grade analysis indicated
that minimum truck speed is reached at the end of
the 6 grade, 1.5 miles from the beginning of the
grade
14
- NSF/(c )(v/c)i (fw) (fp) (fHV)
- SF1500/.91667, c2000, v/c.77(C), fw 1, fp
.9 - ET4, rolling14, upgrade 7, down
- ERV3, rolling 4, upgrade 2, down
- EB3, rolling5.5, upgr. 2.75, down
- fHV-rolling0.54
- fHV-upgrade0.18
- fHV-downgrade0.47
15
- N(rolling)2.2 lanes
- N(upgrade)6.7 lanes
- N(downgrade)2.53 lanes
- To attain LOS C, both rolling and downgrade
require 3 lanes, while upgrade requires 7
lanes!!!! - Truck climbing lane may solve this problem
16
- v/c1667/2000(4)(1)(.9)(.18) 1.28
- This would still result in failure of the upgrade
section. If N 2 lanes - v/c1667/2000(5)(1)(.9)(.18) 1.06 still
failure! - To reduce the severity of the upgrade lower
longer grades,or alter traffic mix (is it
possible?)
17
- Problem 12-6
- Operational analysis problem.
- v/c(4400/.95)/2000(3)(1)(1)(.97) 0.80?LOS(D),
D30 pcpmpl - convert density to vpmpl
- 30.05(1.7)D.95(1)D1.04D
- D29 vpmpl ?SF/D S(4400/.95)/(29)(3)53 mph
18
- Problem 12-8
- Special procedure for truck climbing lanes
- determine LOS for truck lane and compare to LOS
for other lanes(trial and error process) - Downgrade is treated like level terrain (grade is
4 or less) - c(T)2000/ET2000/6333trucks/hr
19
- Facility operate close to capacity, and the truck
lane will carry 333 trucks/hr during the peak 15
min. - Total truck traffic4100(.15)615
- flow rate during peak615/.9683
- remaining trucks in mixed traffic 683-333350
trucks/hr - SF-up(4100/.9)-3334223 vph
20
- trucks(352/4223)(100)8
- SF-downgrade4100/.94556 vph
- trucks 15
- v/c-up4223/2000(3)(1)(1)(.69) 1.01
(barely fails) - v/c-down4556/2000(3)(1)(1)(.9) .84 (LOS D)
Recommended
CrystalGraphics Presentations