
Choropleth Maps - PowerPoint PPT Presentation
1 / 7
Title:
Choropleth Maps
Description:
Choropleth Maps. Used to detect patterns or make comparisons ... Find the mean (range / number of colors you want on the map) How to make a choropleth map: ... – PowerPoint PPT presentation
Number of Views:579
Avg rating:3.0/5.0
Title: Choropleth Maps
1
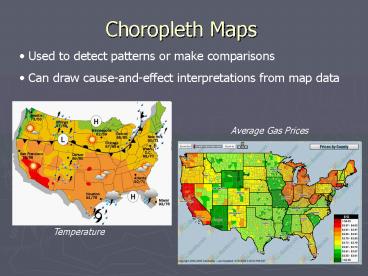
Choropleth Maps
- Used to detect patterns or make comparisons
- Can draw cause-and-effect interpretations from
map data
Average Gas Prices
Temperature
2
Economic indicator terms
- Population
- Births per 1,000 population
- Deaths per 1,000 population
Number of people in a location
Number of live births per 1000 people in a
population of an area
Number of deaths per 1,000 people in a population
on an area
3
Economic indicator terms (cont.)
- Infant Mortality Rate
- Life Expectancy at Birth
- GNI per Person per Capita
Number of infant deaths per 1,000 live births
How long you can expect to live when born in a
certain location
Gross National Income per person the average
amount of money a person earns in a location
4
How to make a choropleth map
Sample Data 100, 80, 79, 67, 45, 20
- Find the range (highest number lowest number)
- Find the mean (range / number of colors you want
on the map)
100 20 80
80 / 4 20
5
How to make a choropleth map
Sample Data 100, 80, 79, 67, 45, 20
- Find your first classification (lowest number
mean)
20 20 40
1st classification 20 40 This means when we
color our map, any number from 20 40 has the
same color.
6
How to make a choropleth map
Sample Data 100, 80, 79, 67, 45, 20
- Find the rest of your classifications (highest
number in previous classification mean)
40 20 60 2nd classification 40 - 60
60 20 80 3rd classification 60 - 80
80 20 100 4th classification 80 - 100
7
Finished map
Sample Data 100, 80, 79, 67, 45, 20
1st classification 20 40 2nd classification
41 60 3rd classification 61 80 4th
classification 81 100
What conclusions can we draw from our map?
Lets try a class example!