
Hydrograph Modeling - PowerPoint PPT Presentation
1 / 33
Title:
Hydrograph Modeling
Description:
Many are based on a 'time of concentration' and many other 'rules' SCS method ... (the area under the unit hydrograph) from 1-square mile in 1-hour (3600 seconds) ... – PowerPoint PPT presentation
Number of Views:209
Avg rating:3.0/5.0
Title: Hydrograph Modeling
1
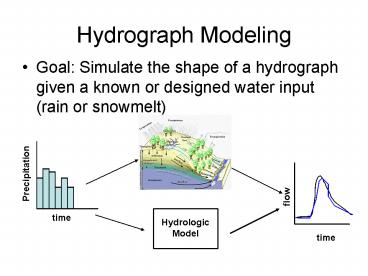
Hydrograph Modeling
- Goal Simulate the shape of a hydrograph given a
known or designed water input (rain or snowmelt)
2
Hydrograph Modeling The input signal
- Hyetograph can be
- A future design event
- What happens in response to a rainstorm of a
hypothetical magnitude and duration - See http//hdsc.nws.noaa.gov/hdsc/pfds/
- A past storm
- Simulate what happened in the past
- Can serve as a calibration data set
3
Hydrograph Modeling The Model
- What do we do with the input signal?
- We mathematically manipulate the signal in a way
that represents how the watershed actually
manipulates the water - Q f(P, landscape properties)
4
Hydrograph Modeling
- What is a model?
- What is the purpose of a model?
- Types of Models
- Physical
- Analog
- Mathematical
- Physically based vs Empirical
5
Hydrograph Modeling
- Physically Based, distributed
Physics-based equations for each process
In each grid cell
See dhsvm.pdf Kelleners et al., 2009a Kelleners
et al., 2009b
Pros and cons?
6
Hydrologic ModelingSystems Approach
A transfer function represents the lumped
processes operating in a watershed -Transforms
numerical inputs through a black box to numerical
outputs -Predictions at outlet only
P
Mathematical Transfer Function
Q
t
t
Pros and Cons?
7
Transfer Functions
- Can be developed to simulate any component of a
hydrograph - Response factor (Weff/W) Volume only
- SCS curve number method
- Estimates Weff
- Rational Method (page 443)
- Qpeak CIA
8
Transfer Functions
- 2 Basic steps to rainfall-runoff transfer
functions - 1. Estimate losses.
- W minus losses effective precipitation (Weff)
- Determines the volume of streamflow response
- 2. Distribute Weff in time
- Gives shape to the hydrograph
Recall that Qef Weff
Event flow (Weff)
Base Flow
9
Transfer Functions
- General Concept
Task Draw a line through the hyetograph
separating loss and Weff volumes
W
Weff Q
W
?
Losses
t
10
Loss Methods
- Methods to estimate effective precipitation
- You have already done it one wayhow?
- However,
11
Loss Methods
- Physically-based infiltration equations
- Chapter 6
- Green-ampt, Richards equation, Darcy
- Kinematic approximations of infiltration and
storage
Exponential Weff(t) W0e-ct c is unique to
each site
W
Uniform Werr(t) W(t) - constant
12
Loss Methods
- SCS curve (page 445-447)
- Calculates the VOLUME of effective precipitation
based on watershed properties (soils) - Assumes that this volume is lost
13
SCS Concepts
- Precipitation (W) is partitioned into 3 fates
- Vi initial abstraction storage that must be
satisfied before event flow can begin - Vr retention W that falls after initial
abstraction is satisfied but that does not
contribute to event flow - Qef Weff event flow
- Method is based on an assumption that there is a
relationship between the runoff ratio and the
amount of storage that is filled - Vr/ Vmax. Weff/(W-Vi) where Vmax is the maximum
storage capacity of the watershed - If Vr W-Vi-Weff,
14
SCS Concept
- Assuming Vi 0.2Vmax (??)
- Vmax is determined by a Curve Number
15
Curve Number
The SCS classified 8500 soils into four
hydrologic groups according to their infiltration
characteristics
16
Curve Number
- Related to Land Use
17
Transfer Function
- 1. Estimate effective precipitation
- SCS method gives us Weff
- 2. Estimate temporal distribution
Volume of effective Precipitation or event flow
-What actually gives shape to the hydrograph?
18
Transfer Function
- 2. Estimate temporal distribution of effective
precipitation - Various methods route water to stream channel
- Many are based on a time of concentration and
many other rules - SCS method
- Assumes that the runoff hydrograph is a triangle
On top of base flow
Tw duration of effective P Tc time
concentration
Q
How were these equations developed?
Tb2.67Tr
t
19
Transfer Functions
- Time of concentration equations attempt to relate
residence time of water to watershed properties - The time it takes water to travel from the
hydraulically most distant part of the watershed
to the outlet - Empically derived, based on watershed properties
Once again, consider the assumptions
20
Transfer Functions
- 2. Temporal distribution of effective
precipitation - Unit Hydrograph
- An X (1,2,3,) hour unit hydrograph is the
characteristic response (hydrograph) of a
watershed to a unit volume of effective water
input applied at a constant rate for x hours. - 1 inch of effective rain in 6 hours produces a 6
hour unit hydrograph
21
Unit Hydrograph
- The event hydrograph that would result from 1
unit (cm, in,) of effective precipitation
(Weff1) - A watershed has a characteristic response
- This characteristic response is the model
1
Qef
1
t
22
Unit Hydrograph
- How do we Develop the characteristic response
for the duration of interest the transfer
function ? - Empirical page 451
- Synthetic page 453
- How do we Apply the UH?
- For a storm of an appropriate duration, simply
multiply the y-axis of the unit hydrograph by the
depth of the actual storm (this is based
convolution integral theory)
23
Unit Hydrograph
- Apply For a storm of an appropriate duration,
simply multiply the y-axis of the unit hydrograph
by the depth of the actual storm. - See spreadsheet example
In this picture, what duration is 2.5 hours
Referring to? Where does 2.4 come from?
24
Unit Hydrograph
- How do we derive the characteristic response
(unit hydrograph)? - Empirical
25
Unit Hydrograph
- How do we derive the characteristic response
(unit hydrograph)? - Empirical page 451
- Note 1. approximately equal duration
- What duration are they talking about?
- Note 8. adjust the curve until this area is
satisfactorily close to 1unit - See spreadsheet example
26
Unit Hydrograph
- Assumptions
- Linear response
- Constant time base
27
Unit Hydrograph
- Construction of characteristic response by
synthetic methods - Scores of approaches similar to the SCS
hydrograph method where points on the unit
hydrograph are estimated from empirical relations
to watershed properties. - Snyder
- SCS
- Clark
28
Snyder Synthetic Unit Hydrograph
- Since peak flow and time of peak flow are two of
the most important parameters characterizing a
unit hydrograph, the Snyder method employs
factors defining these parameters, which are then
used in the synthesis of the unit graph (Snyder,
1938). - The parameters are Cp, the peak flow factor, and
Ct, the lag factor. - The basic assumption in this method is that
basins which have similar physiographic
characteristics are located in the same area will
have similar values of Ct and Cp. - Therefore, for ungaged basins, it is preferred
that the basin be near or similar to gaged basins
for which these coefficients can be determined.
The final shape of the Snyder unit hydrograph is
controlled by the equations for width at 50 and
75 of the peak of the UHG
29
SCS Synthetic Unit Hydrograph
Triangular Representation
The 645.33 is the conversion used for delivering
1-inch of runoff (the area under the unit
hydrograph) from 1-square mile in 1-hour (3600
seconds).
30
Synthetic Unit Hydrograph
- ALL are based on the assumption that runoff is
generated by overland flow - What does this mean with respect to our
discussion about old water new water? - How can Unit Hydrographs, or any model, possibly
work if the underlying concepts are incorrect?
31
Other Applications
- What to do with storms of different durations?
32
Other Applications
- Deriving the 1-hr UH with the S curve approach
33
(No Transcript)