
Statistic - PowerPoint PPT Presentation
1 / 19
Title:
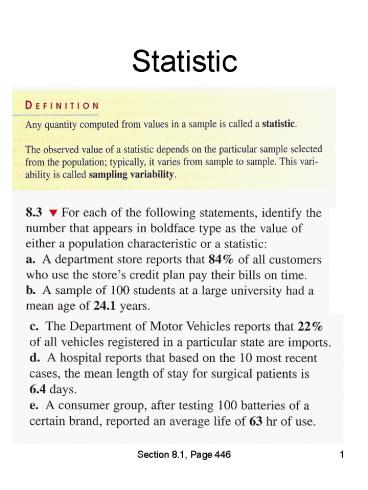
Statistic
Description:
Length of Overtime Periods in Hockey. Section 8.2, Page 454. 7. Central Limit Theorem ... Consider a Statistics class and the variable gender. If 32 ... – PowerPoint PPT presentation
Number of Views:25
Avg rating:3.0/5.0
Title: Statistic
1
Statistic
2
Sampling Variability Example
Illustrative population of 20 Students
Random Sample 1 331, 423, 322, 419, 378 Mean of
Sample 1 374.60
3
Sampling Variability Example
Additional Samples from the Population
The true mean of the population is 360.25
The fact that the different samples from the
samepopulation produce sample means that are
differentfrom each other and different from the
true meanillustrates natural sampling variation
4
Sampling Distribution of
Here is the density histogram for the sample
means of 50 different student samples for n5
There are 15,504 possible student samples on n5.
The sampling distribution would be the density
histogram of the 15,504 sample means.
5
Problems
Compute mean the for each of the 12 possible
samples. Use this information to construct a
sampling distribution. Display the sampling
distribution as a histogram.
6
Central Limit Theorem
Length of Overtime Periods in Hockey
7
Central Limit Theorem
Histograms for 500 sample means for sample sizes
n5, 10, 20, and 30.
The population has significant positive skew and
ranged from 0 to 40. At n30, the distribution
of the sample means is symmetrical and the sample
means range from 5 to 15.
8
Central Limit Theorem
Mean of Sampling Distribution Mean of Population
N 30 is usually large enough. If the
population is without outliers and significant
skew, n15 is ok.
9
Problems
10
Problems
11
Problems
12
Problems
8.19 A manufacturing process is designed to
produce bolts with a 0.5-in. diameter and a
standard deviation of 0.02. Once each day, a
random sample of 36 bolts is selected and the
diameters recorded. If the resulting sample mean
is less than 0.49 in. or greater than 0.51 in.,
the process is shut down for adjustment. What is
the probability that the process will be shut
down unnecessarily? (Hint Find the probability
of observing a sample mean in the shutdown range
when the true process mean is really 0.5 in.)
13
Proportions
Proportions relate to categorical variables. A
proportion is the relative frequency of the
population for a value of a categorical
variable. Consider a Statistics class and the
variable gender. If 32students of 50 are
female, then we say the population proportion p
equals 32/500.64. If we are interested in
thefemales, we say there 32 successes, females,
and 18 males, failures. The population
proportion of failures is always 1-p
18/500.34.If we take a sample of 10 students,
and 6 are female, we say the sample proportion,
p, is 0.60. The number of success in the sample
is 6 and the number offailures is 4.
14
Sampling Distributions for Proportions
Example The population proportion, p, of
peoplereceiving multiple blood transfusions who
contract hepatitis is .07. We simulate samples
of n10, 25, 50, and 100
15
Sampling Distribution for p
The mean of the sampling distribution
population prop.
16
Problems
17
Problems
18
Problems
19
Problems
Recommended
CrystalGraphics Presentations


