
Greenhouse Gases - PowerPoint PPT Presentation
1 / 21
Title:
Greenhouse Gases
Description:
Material Average GHG Emissions from 2000 (in kg CO2eq / kg of material) ... Plastic housing and keypad. Liquid crystal display (LCD) Printed wiring board (PWB) ... – PowerPoint PPT presentation
Number of Views:44
Avg rating:3.0/5.0
Title: Greenhouse Gases
1
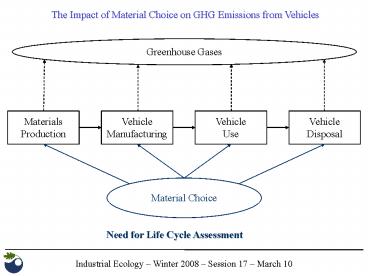
The Impact of Material Choice on GHG Emissions
from Vehicles
Greenhouse Gases
Materials Production
Vehicle Manufacturing
Vehicle Use
Vehicle Disposal
Material Choice
Need for Life Cycle Assessment
2
The Impact of Material Choice on GHG Emissions
from Vehicles
Material Average GHG Emissions from 2000 (in
kg CO2eq / kg of material) Primary
Production Secondary Production Steel
2.3 2.7 0.7 1.0 AHSS 2.3
2.7 0.7 1.0 Aluminum 13.9 15.5 1.4
2.0
Materials Production
Vehicle Manufacturing
Vehicle Use
Vehicle Disposal
Material Choice
Source IISI, IAI
3
The Impact of Material Choice on GHG Emissions
from Vehicles
Material All Estimates for Material
in Body-in-White Applications Recycled
Content Weight Savings Potential Steel
11 15 AHSS 11 15 25
Aluminum 0 11 30 50
Materials Production
Vehicle Manufacturing
Vehicle Use
Vehicle Disposal
Material Choice
4
The Impact of Material Choice on GHG Emissions
from Vehicles
Parameter Value
Range Fuel Savings per Weight Savings ) (in
l/100km per 100kg saved)
0.11 0.48 Total vehicle mileage 100,000
291,543 km
Materials Production
Vehicle Manufacturing
Vehicle Use
Vehicle Disposal
Material Choice
) Source fka
5
Relationship between material choice and use
phase GHG emissions
Rolling resistance
Aerodynamic drag
Gravity
Acceleration
6
Calculation of GHG reductions during vehicle use
phase
Secondary mass savings
Material replacement coefficient
Replaced material
Energy savings per mass savings
Total distance driven during use phase
Well-to-wheels (WTW) GHG emissions of fuel
7
Energy savings per mass savings ES
Power traintype
Driving cycle
Power trainadjustment
Midsize vehicle
Sources Forschungsgesellschaft Kraftfahrwesen
Aachen (FKA) 2006
8
The Impact of Material Choice on GHG Emissions
from Vehicles
Material Recycling rate Scrap mainly
used for Steel 90 96 Long Products
and AHSS 90 96 Engineering
Steels Aluminum 83 90 Castings
Materials Production
Vehicle Manufacturing
Vehicle Use
Vehicle Disposal
Material Choice
9
The avoided burden principle credit debit
The system is expanded to include additional
burdens of co-product processing and the avoided
burdens of any displaced processes
Vehicle production v
Vehicle
Boundaries of original system
Recycling process r
Primary production p
Building production b
Building
Boundaries of expanded system
Environmental burdens
Vehicle Building Ev Er Eb
Vehicle Ev Er Ep Ev (Ep Er)
Credit
Building Ep Eb Er Eb (Ep Er)
Debit
10
The Impact of Material Choice on GHG Emissions
from Vehicles
Materials Production
Vehicle Manufacture
Vehicle Use
Vehicle End of Life
CO2eq
end-of-life recycling
vehicle use
Total mileage
material production
TM
11
Environmental Product Design Example Cell
Phones
Cell Phone Components
- Plastic housing and keypad
- Liquid crystal display (LCD)
- Printed wiring board (PWB)
- Connectors
- Active electronic components (e.g. integrated
circuits) - Passive electronic components (e.g.
capacitors and resistors) - Microphones and speakers
12
Material Composition of Cell Phones
WEEE Directive Category 3 products 75
Recovery 65 Recycling and reuse
13
Life Cycle of a Cell Phone
Integrated Product Policy Pilot Project Stage I
Environmental issues Stage II Improvement
options Stage III Evaluation of options All
reports are posted on thecourse website
14
Environmental Assessments of Cell Phones at Nokia
- Wright 1999 Life cycle energy analysis
- Scope 92-94 (160 gr) and 95-96 (130 gr)
cell phones, production, use, eol management,
exclude battery, charger, network infrastructure - Functional unit Use of the cell phone for 2.5
years - Impact categories Primary energy consumption
(PEC)
- Frey 2002 Environmental footprint analysis
- Scope 92-94 (160 gr) and 95-96 (130 gr)
cell phones, production, use, eol management,
exclude battery, charger, network infrastructure - Functional unit Use of the cell phone for 2.5
years - Indicator Total area required to produce
required resources and assimilate generated wastes
- McLaren Piukkula 2003 Life cycle assessment
(using GaBi3) - Scope 2000 cell phone (90 gr), production and
use, no eol management include battery and
charger, exclude network infrastructure - Functional unit Use of the cell phone for 2
years - Impact categories Primary energy consumption
(PEC), global warming potential (GWP), Ozone
depletion potential (ODP), acidification
potential (AP), human toxicity potential (HTP),
photochemical oxidant creation potential (POCP)
15
Summary of environmental hotspots of a cell phone
- Life cycle stages Component manufacture and use
phase - Environmental concern energy consumption,
hazardous wastes emissions - Use phase Stand-by power consumption of the
charger - Component manufacture Energy consumption of
manufacturing processes - Components with highest environmental impacts
PWB, ICs, LCD - Transportation Airfreight accounts for almost
all of environmental impacts - End-of-life Hazardous substances in products
(e.g. Pb, Cr, Ni, Cu, Sb) - Beyond the handset Energy consumption of radio
base station
16
Cell Phone Life Cycle Primary Energy Consumption
(PEC)
1) 2003 Nokia study gives only 150 MJ for product
manufacture. Breakdown is from an earlier
Nokia study from 1999, as is the end-of-life
assessment.
Perspective 275 MJ is the gross calorific value
of 7.9 liters of gasoline, or 52 km in a
Lincoln Navigator, or 185 km in a Toyota Prius.
17
Options for improving life cycle environmental
performance of cell phones
- Improvement in cell phone design
- Optimizing the in-use life-span of cell phone
- Less energy and environmentally relevant
chemicals during component manufacture - Change buying, usage and disposal behavior of
consumers - Improve eol management of cell phones
- Reduce energy consumption of network
infrastructure - Develop environmental assessment methods/tools
- Need for policies to support environmental
performance improvements
18
Handset mass and gold content have been declining
over the past ten years
gr
Gold contains 60 - 80 of the economic value
of the materials (depending on the palladium
content) 65 - 75 of the energy embodied in the
materials
19
Therefore economic and environmental benefitsdue
to gold recycling has been declining as well
MJ
Question How much longer will cell phone
recycling be profitable?
20
Alternatives to cell phone recycling
Phonedemand use
End-of-life phone disposal
Primary materialsproduction
Componentsmanufacture
Final phoneassembly
Phone refurbishment
Component reuse
End-of-life phone collection
Inspection sorting
Metalsmarket
Metals recycling
21
Reading for Friday, 10 MarchTim Jackson (2005)
Live Better by Consuming Less?, Journal of
Industrial Ecology, 9(1-2) 19-36(posted on
course website)