
Titrations - PowerPoint PPT Presentation
1 / 29
Title:
Titrations
Description:
Procedures in which we measure the volume of reagent needed to react with an analyte ... in the mantissa of p function. Titrations. Precipitation Titration Curve ... – PowerPoint PPT presentation
Number of Views:1172
Avg rating:3.0/5.0
Title: Titrations
1
Titrations
- Introduction
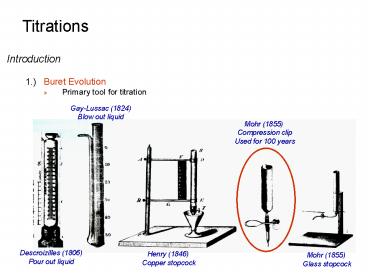
- 1.) Buret Evolution
- Primary tool for titration
Gay-Lussac (1824) Blow out liquid
Mohr (1855) Compression clip Used for 100 years
Descroizilles (1806) Pour out liquid
Henry (1846) Copper stopcock
Mohr (1855) Glass stopcock
2
Titrations
- Introduction
- 2.) Volumetric analysis
- Procedures in which we measure the volume of
reagent needed to react with an analyte - 3.) Titration
- Increments of reagent solution (titrant) are
added to analyte until reaction is complete. - - Usually using a buret
- Calculate quantity of analyte from the amount of
titrant added. - Requires large equilibrium constant
- Requires rapid reaction
- - Titrant is rapidly consumed by analyte
Controlled Chemical Reaction
3
Titrations
- Introduction
- 4.) Equivalence point
- Quantity of added titrant is the exact amount
necessary for stoichiometric reaction with the
analyte - - Ideal theoretical result
Equivalence point occurs when 2 moles of MnO4- is
added to 5 moles of Oxalic acid
4
Titrations
- Introduction
- 5.) End point
- What we actually measure
- - Marked by a sudden change in the physical
property of the solution - - Change in color, pH, voltage, current,
absorbance of light, presence/absence ppt.
CuCl Titration with NaOH
End Point
After the addition of 8 drops of NaOH
Before any addition of NaOH
5
Titrations
- Introduction
- 5.) End point
- Occurs from the addition of a slight excess of
titrant - - Endpoint does not equal equivalence point
After equivalence point occurs, excess MnO4-
turns solution purple ? Endpoint
6
Titrations
- Introduction
- 5.) End point
- Titration Error
- - Difference between endpoint and equivalence
point - - Corrected by a blank titration
- i. repeat procedure without analyte
- ii. Determine amount of titrant needed to
observe change - iii. subtract blank volume from titration
- Primary Standard
- - Accuracy of titration requires knowing
precisely the quantity of titrant added. - - 99.9 pure or better ? accurately measure
concentration
Analyte Oxalic acid (colorless)
Titrant (purple)
7
Titrations
- Introduction
- 6.) Standardization
- Required when a non-primary titrant is used
- - Prepare titrant with approximately the desired
concentration - - Use it to titrate a primary standard
- - Determine the concentration of the titrant
- - Reverse of the normal titration process!!!
Titration
Standardization
titrant known concentration
titrant unknown concentration
analyte unknown concentration
analyte known concentration
8
Titrations
- Introduction
- 7.) Back Titration
- Add excess of one standard reagent (known
concentration) - - Completely react all the analyte
- - Add enough MnO4- so all oxalic acid is
converted to product - Titrate excess standard reagent to determine how
much is left - - Titrate Fe2 to determine the amount of MnO4-
that did not react with oxalic acid - - Differences is related to amount of analyte
Analyte Oxalic acid (colorless)
Titrant (purple)
(colorless)
(colorless)
9
Titrations
- Titration Calculations
- 1.) Key relate moles of titrant to moles of
analyte - 2.) Standardization of Titrant Followed by
Analysis of Unknown
Calculation of ascorbic acid in Vitamin C tablet
- Starch is used as an indicator starch I3- ?
starch-I3- complex - (clear) (deep blue)
(ii) Titrate ascorbic acid with I3-
1 mole ascorbic acid ? 1 mole I3-
10
Titrations
- Titration Calculations
- 2.) Standardization of Titrant Followed by
Analysis of Unknown
Standardization Suppose 29.41 mL of I3- solution
is required to react with 0.1970 g of pure
ascorbic acid, what is the molarity of the I3-
solution?
11
Titrations
- Titration Calculations
- 2.) Standardization of Titrant Followed by
Analysis of Unknown
Analysis of Unknown A vitamin C tablet
containing ascorbic acid plus an inert binder was
ground to a powder, and 0.4242g was titrated by
31.63 mL of I3-. Find the weight percent of
ascorbic acid in the tablet.
12
Titrations
- Spectrophotometric Titrations
- 1.) Use Absorbance of Light to Follow Progress of
Titration - Example
- - Titrate a protein with Fe3 where product
(complex) has red color - - Product has an absorbance maximum at 465 nm
- - Absorbance is proportional to the concentration
of iron bound to protein
Analyte (colorless)
(red)
titrant (colorless)
As Fe3 binds protein solution turns red
13
Titrations
- Spectrophotometric Titrations
- 1.) Use Absorbance of Light to Follow Progress of
Titration - Example
- - As more Fe3 is added, red color and absorbance
increases, - - When the protein is saturated with iron, no
further color can form - - End point intersection of two lines (titrant
has some absorbance at 465nm)
When all the protein is bound to Fe3, no further
increase in absorbance.
As Fe3 continues to bind protein red color and
absorbance increases.
14
Titrations
- Spectrophotometric Titrations
- 1.) Use Absorbance of Light to Follow Progress of
Titration - Example
- - As more Fe3 is added, concentration changes
due to dilution - - Need to correct absorbance for dilution.
Total volume changes after each addition
15
Titrations
- Precipitation Titration Curve
- 1.) Graph showing how the concentration of one of
the reactants varies as titrant is added. - Understand the chemistry that occurs during
titration - Learn how experimental control can be exerted to
influence the quality of an analytical titration - - No end point at wrong pH
- - Concentration of analyte and titrant and size
of Ksp influence end point - - Help choose indicator for acid/base and
oxidation/reduction titrations
Sharpness determined by titration condition
Monitor pH, voltage, current, color, absorbance,
ppt.
16
Titrations
- Precipitation Titration Curve
- 2.) Because concentration varies over many orders
of magnitude, plot p function - 3.) Example
p function where X is concentration of X
Consider the titration of 25.00 mL of 0.1000M I-
with 0.05000M Ag
Since Ksp is so small, each addition of Ag
reacts completely with I-
17
Titrations
- Precipitation Titration Curve
- 3.) Example
At equivalence point, sudden increase in Ag
concentration. - All I- has been consumed
What volume (Ve) of Ag titrant is need to reach
the equivalence point?
mol Ag
mol I-
One mole of Ag reacts with one mol I-
18
Titrations
- Precipitation Titration Curve
- 4.) Three distinct regions in titration curve
- Before, at and after the equivalence point.
- Before the Equivalence Point
- - All titrant Ag is consumed, free I- is
I- that has not been precipitated. - - Negligible I- from AgI(s) (Ksp)
after
at
before
Moles of I- original moles of I- - moles of Ag
added
19
Titrations
- Precipitation Titration Curve
- 4.) Three distinct regions in titration curve
- Before the Equivalence Point
- - Concentration of Ag is governed by Ksp
Consider the titration of 25.00 mL of 0.1000M I-
with 10 mL of 0.05000M Ag
Moles of I- original moles of I- - moles of Ag
added
Volume is 0.3500 L ( 25.00 mL 10.00 mL)
Concentration of Ag in equilibrium with this
much I-
20
Titrations
- Precipitation Titration Curve
- 4.) Three distinct regions in titration curve
- Before the Equivalence Point
- - Concentration of Ag is governed by Ksp
- At Equivalence Point
- - added exactly enough Ag to react with all I-
p function
2 sig. fig. ? 2 sig. fig. in the mantissa of p
function
21
Titrations
- Precipitation Titration Curve
- 4.) Three distinct regions in titration curve
- After Equivalence Point
- - All Ag added before equivalence point has
ppt. - - Ag is determined by Ag added after the
equivalence point. - gt volume after equivalence point
For 2 mL of Ag added past equivalence point
22
Titrations
- Shape of Titration Curve
- 1.) Equivalence point is the steepest point of
the curve. - Point of maximum slope ? inflection point ?
second derivative is zero
23
Titrations
- Shape of Titration Curve
- 2.) Affect of Ksp on Titration Curve.
- Lowest solubility gives steepest change at
equivalence point
Magnitude of concentration change and ease of
identifying equivalence point increases with Ksp
24
Titrations
- Titration of a Mixture
- 1.) Product with the Smaller Ksp Precipitates
First - Two Stage Titration Curve
- - Assumes significant difference in Ksp
First, AgI ppt.
Titrate Mixture of KI and KCl with AgNO3
Then, AgCl ppt.
Ksp(AgI) ltlt Ksp(AgCl)
AgI ppt. not complete at midpoint
25
Titrations
- End-Point Detection
- 1.) Precipitation Titration
- End points detected with electrode or indicator
- - Electrode converts concentration of specific
ion into measurable current or - potential.
- - Indicators
- Volhard titration formation of a soluble,
colored complex at the end point - Fajans titration adsorption of a colored
indicator on the precipitate at the end - point
pH electrode responds to H
26
Titrations
- End-Point Detection
- 1.) Precipitation Titration
- Volhard titration (First Published in 1874)
Determine Cl-
First ppt. Cl- by titration with Ag and filter
off solid
Titrate excess Ag with thiocyanate (SCN-)
When all Ag is consumed, thiocyanate binds Fe3.
Appearance of Red color is endpoint
Total amount of Ag is known, so amount consumed
by Cl- can be calculated Subtract excess Ag
from total Ag used to ppt. Cl-
27
Titrations
- End-Point Detection
- 1.) Precipitation Titration
- Fajans titration
- - Uses an adsorption indicator
28
Titrations
- End-Point Detection
- 1.) Precipitation Titration
- Fajans titration
- Anionic dyes
- - Maximize surface area ? higher binding?
stronger color change - - small particle size ? low concentration
- - most use appropriate pH to maintain negative
charge
Sharper color transition, binds to tightly to Cl-
Changes from greenish yellow to pink
29
Titrations
- End-Point Detection
- 2.) Typical Applications
- Also indicates potential sources of interference
- - other ions/analytes may be present in sample
Recommended
CrystalGraphics Presentations


