
Ice Core Paleoclimate Research Group - PowerPoint PPT Presentation
1 / 113
Title: Ice Core Paleoclimate Research Group
1
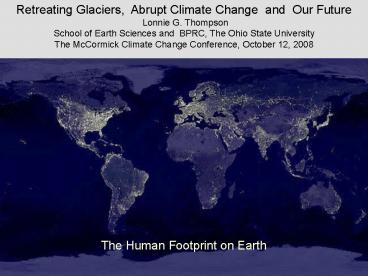
Retreating Glaciers, Abrupt Climate Change and
Our Future Lonnie G. Thompson School of Earth
Sciences and BPRC, The Ohio State University The
McCormick Climate Change Conference, October 12,
2008
Ice Core Paleoclimate Research
Group Ellen Mosley-Thompson Henry Brecher Mary
Davis Paolo Gabrielli Ping-Nan Lin Matt
Makou Victor Zagorodnov
Graduate Students Liz Birkos Aron Buffen
Natalie Kehrwald David Urmann Lijia Wei
Funding provided by NSF Paleoclimate and
Polar Programs NASA Earth Sciences
(Glaciology) NOAA Paleoclimatology Gary
Comer Foundation OSU Climate, Water Carbon
Program
2
-
Objectives - Introduction to climate change
- Glaciers our most visible evidence of global
warming - Evidence for abrupt climate change past and
present - Evidence for recent acceleration in the rates of
ice loss in the tropics A Clear and Present
Danger - A time perspective for the current climate change
- Conclusions
3
Natural mechanisms influence climate
- Changes in the Sun
- Changes in the amount of volcanic dust in the
atmosphere - Internal variability of the coupled
atmosphere-ocean system (e.g., ENSO, monsoon
systems, NAO)
Natural mechanisms
4
Human factors also influence climate
- Non-natural mechanisms
- Changes in the concentrations of atmospheric
greenhouse gases - Changes in aerosols and particles from burning
fossil fuels (sulfate aerosols) and biomass
(black carbon) - Changes in the reflectivity (albedo) of the
Earths surface
Smoke from fires in Guatemala and Mexico (May 14,
1998)
5
Our Earth is warming!
relative to the 1951-1980 mean
Year A.D.
httpwww.giss.nasa.gov/research/news
6
?
?
7
Carbon Dioxide Methane Concentrations Past,
Present and Future
IPCC 2000 Scenario A1B for 2100 AD
Today CO2 is 378 ppmv CH4 is 1750 ppbv
Lüthi et al., Nature, May 15, 2008
8
5
Global average surface temperature is heading not
only far outside the range of variation of the
last 1000 years but outside the range experienced
in the tenure of Homo sapiens on Earth.
4
Global Temperature (C)
3
2
1
0.4
0
0
-0.4
-0.8
Year A.D..
9
Earths ice sheets and glaciers preserve long,
high resolution histories
East Antarctica Plateau
2002
Quelccaya Ice Cap, Peru
10
Guliya ice cap, Tibet
11
(No Transcript)
12
Collapsing ice shelves dont raise sea level
directly ..
10
Floating ice shelves do not contribute to sea
level rise.
90
Scambos et al., 2004 observations
13
2008
14
(No Transcript)
15
Greenland More and larger summer melt lakes
Water flowing into a moulins
Photo by Roger J. Braithwaite
16
Over most of the 20th century sea level rise
was 2 mm per year Primary contributors
- thermal expansion of ocean (50) -
alpine glacier mass loss (30) - ice
sheet mass loss (10-20) - pumping
groundwater (irrigation) few
Currently, 60 of the land-based ice loss comes
from small glaciers ice caps, not the two ice
sheets. The ice loss from mountain glaciers may
raise sea level 0.25 meters by 2100. (Meier et
al., Science, 2007)
How will they behave in the future?
17
Ice cores provide unique histories from
regions where other recording systems are limited
or absent
Huascarán, Peru
Dasuopu Glacier Southern Tibet
18
(No Transcript)
19
(No Transcript)
20
(No Transcript)
21
(No Transcript)
22
(No Transcript)
23
(No Transcript)
24
(No Transcript)
25
(No Transcript)
26
(No Transcript)
27
Quelccaya 2003, Summit Core
28
77 new cores
High elevation, low latitude ice cores record -
large-scale climate changes - regional differences
Reference period (1961 1990 A.D.)
LIA
MWP
Thompson et al., PNAS, 2006
Thompson et al., PNAS, 2006
29
McCall Glacier, Brooks Range, Alaska
Austin Post,1958
Matt Nolan, 2003
30
Muir Glacier, SE Alaska
August, 1941 (photo by William Field)
August, 2004 (photo by Bruce Molnia)
31
Massive retreat of low-latitude glaciers today
2002
Gangapurna Glacier
Courtesy Doug Burbank, UCSB
32
Massive retreat of low-latitude glaciers today
2002
Gangapurna Glacier
1957
Courtesy Doug Burbank, UCSB
33
Ghiacciai della Lobbia e dellAdamello/Mandrone
(102 anni)
34
(No Transcript)
35
DJF Uniform tropical upper-air temperature
DJF Larger SST variations
DJF Rainfall roughly follows warm SST
(Sobel and Bretherton, J. Climate , 2000
36
(No Transcript)
37
Drill shelter on Northern Ice Field, Kilimanjaro
in 2000
38
(No Transcript)
39
(No Transcript)
40
Northern Ice Field Stake 2 (2000)
- -2.5 meters in 6 years between Feb. 2000 and Jan.
2007, FWG -2.5 m - SIF over -5.5 m
41
16 Feb 2000
28 Jan 2006
15 Oct 2007
42
Furtwängler Glacier
16 Feb 2000
28 Jan 2006
15 Oct 2007
43
(No Transcript)
44
(No Transcript)
45
(No Transcript)
46
Himalayan glaciers store about 12,000 cubic
kilometers of freshwater in 15,000 glaciers and
are the lifeline for millions of people (IPCC,
2007)
47
(No Transcript)
48
(No Transcript)
49
(No Transcript)
50
(No Transcript)
51
(No Transcript)
52
(No Transcript)
53
(No Transcript)
54
(No Transcript)
55
(No Transcript)
56
(No Transcript)
57
(No Transcript)
58
Retreat of the Qori Kalis Glacier (Peru)
1978 no lake
2008 lake covers 84 acres
59
Qori Kalis, July 2005
60
Qori Kalis, July 2006
61
(No Transcript)
62
1977
63
2006
64
Boulder, 1978
65
Boulder, 2006
66
(No Transcript)
67
(No Transcript)
68
(No Transcript)
69
(No Transcript)
70
- Glaciers, especially tropical glaciers, are
- the canaries in the coal mine
- for our global climate system as they integrate
and - respond to most key climatological variables
such as - temperature, precipitation, cloudiness,
humidity - and radiation.
- Global glacier retreat at the beginning of the
21st Century is driven mainly by increasing
temperatures although regional factors (i.e.,
deforestation also may play a role).
71
Martin Chambi J. Mid-1930s
Qoyllur Riti, Peru 2006
72
(No Transcript)
73
(No Transcript)
74
Quelccaya, Peru
1977
2002
75
Quelccaya Ice Cap, 2002
200 400 m above its modern range
Plant
76
(No Transcript)
77
5177 45 yr. B.P.
78
(No Transcript)
79
(No Transcript)
80
Rodbell and others, 2008
81
(No Transcript)
82
(No Transcript)
83
(No Transcript)
84
- Climatologically we are in unfamiliar territory,
and the worlds ice cover is responding
dramatically.
85
Courtesy of Dan Schrag, Harvard Univ.
86
Courtesy of Dan Schrag, Harvard Univ.
87
(No Transcript)
88
(No Transcript)
89
(No Transcript)
90
So society has three options!
- Prevention, means taking measures to reduce the
pace magnitude of the changes in global climate
being caused by human activities. - Examples of prevention include reducing
emissions of GHG, enhancing sinks for these
gases, and geoengineering to counteract the
warming effects of GHG.
- Adaptation, means taking measures to reduce the
adverse impacts on human well-being that result
from the climate changes that do occur. - Examples of adaptation include changing
agricultural practices, strengthening defenses
against climate-related disease, and building
more dams and dikes. But its a moving target!
- Suffering, the adverse impacts that are not
avoided by either mitigation or adaptation.
91
(No Transcript)
92
Key points made in this presentation
The recently documented mass loss from
Kilimanjaro, Africa (5893 masl) and Naimonanyi ,
Himalayas (6050 masl) is disturbing given the
projected 21st Century warming for
high-elevations in the low-latitudes.
Climatologically we are in unfamiliar territory,
and the worlds ice cover is responding
dramatically.
Glaciers are our most visible evidence of global
warming. They integrate many climate variables
in the Earth system. Their loss is readily
apparent and they have no political agenda.
93
There are three stages in scientific
discoveryFirst, people deny that it is
true then, they deny that it is
importantFinally, they credit the wrong person
- Alexander von Humboldt, 1769-1859. (from Byrson,
B. - A Short History of Nearly Everything, 2003 page
421)
94
(No Transcript)
95
(No Transcript)
96
(No Transcript)
97
Greenland losing mass overall
Gaining mass at high elevations
(increased precipitation) Losing mass
rapidly along coast
Overall balance -100 Gigaton (Gt)
annually
Shepherd Wingham, Science, 2007
360 Gt of water 1 mm of eustatic sea level rise
6 to 7 meters sea level rise equivalent
98
Antarctica is likely losing mass 42 to
-139 Gt per year
Shepherd Wingham, Science, 2007
99
(No Transcript)
100
- Why contrarians are wrong! Balance of
evidence - Models predict and the data show that
- Stratosphere cools as surface warms (variations
in the suns output, would instead cause similar
trends in the two atmospheric layers instead of
opposite ones) - Temperatures have warmed more at night than
during the day up until the late 1990s now the
day and night are warming equally (This is
unlikely to be caused by solar variability and is
likely linked to the greenhouse gases that hold
in heat radiating from Earths surface, even
after sunset) - Temperatures have risen more in winter than in
summer (opposite that would be expected if the
sun was driving temperature increase) - High latitudes have warmed more than low
latitudes (since more radiation is received at
low latitudes - you would expect the opposite if
the sun were driving change) - There has been a parallel warming trend over land
and oceans, (the increase in the amount of
heat-trapping asphalt is not the only culprit) - Several dozen top models have become
progressively better at replicating climate
patterns, past and the present (the only way to
replicate the remarkable warming, and
extraordinary Arctic warming, of the recent
decades is to add greenhouse gases).
101
Some contrarians have tried to convince the
public that this recent warming is due to
increased output of solar radiation
httpwww.giss.nasa.gov/research/news
102
Clearly the output of the sun has not
increased since 1975 and thus increased solar
output can not account for the warming of the
last 30 years (1975 to 2001).
Updated to 2007
103
In low latitudes does d18O reflect primarily
temperature or precipitation?
d18O (o/oo)
Accumulation (m w.e. a-1)
d18O (o/oo)
Accumulation (m w.e. a-1)
104
(No Transcript)
105
(No Transcript)
106
(No Transcript)
107
(No Transcript)
108
ATMOSPHERE
Interactions
T.G./precipitation or
firn grains
Air mixing
AIR
IN
Air dating
Gravitation
FIRN
uncertainties
AIR
Clathrate
Diffusion
BUBBLES
formation
IN ICE
Experimental
uncertainties
ICE SAMPLE
FOR
T.G. MEASUREMENTS
109
Characteristics of Drill Sites in Greenland and
Antarctic (Temperature, Accumulation and
Information on Gas Enclosure)
Site Location Mean Annual
Air Annual Width of Age Difference
Between Temperature, Accum., Distribution,
Age of Ice Mean
C m years Age of Air,
years Measured Data Siple
Station 7555'S, 8355'W -24 0.5 22
95 Calculated Data Vostok 7828'S,10655
'E -57 0.022 590 2800 Dome
C 7439'S,12410'E -53 0.036 370 1700 Sou
th Pole 9000'S, -51 0.084 220
950 Byrd Station 7959'S,12001'W -28 0.16
54 240 North Central 7437'N,
3936'W -31.7 0.11 76
350 Crête 7107'N, 3719'W -30 0.265
46 200 Camp Century 7711'N,
6109'W -24 0.34 31 130 Dye
3 6511'N, 4350'W -19.6 0.5 22 90
110
- U.S. Fossil Fuel Addiction especially to foreign
oil! - 1970 we imported 24 of our oil
- Today its nearly 70 and growing
- 700 billion dollars currently flowing out of the
U.S. each yearthats four times the annual cost
of the Iraq war. - 85 million barrels of oil are produced around the
world and the U.S. with just 4 of the worlds
population consumes 25 of the worlds oil - World oil production likely peaked in 2005!
- There are no silver bullets to solve our energy
crisis but there are lots of silver buckshot!
111
- Investments for Global Climate Change (winners
and losers/greed and fear) - Some Changes underway
- Conservation
- Increased efficiency
- Four cylinders and hybrids soar in popularity
- Renewable energy such as
- Fuel cells
- Zero emission coal-burning power plants
- IGCC (Integrated gasification
combined cycle) - Solar (photovoltaic cells, passive solar, etc.)
- Geothermal and recovered energy power plants
- Ethanol
- Wind power
- Mass transit/light rail, buses, etc.
- Housing design - toward more compact cities
- Nanotechnology
112
- What you can do and save money!
(http//www.climatecrisis.net) - Buy organic foods as much as possible
- Avoid heavily packaged products
- Eat less meat
- Reduce the number of miles you drive
- Carpool
- Keep your car tuned up
- Check your tires weekly to make sure they are
properly inflated - Choose a fuel efficient vehicle
- Try car sharing
- Fly less
113
- Traditional call in the United States from a
prison guard as a condemned prisoner is led to
Death Row Dead man walking, Dead man
walking, here.
- Since there is a time lag in our climate system
it takes several decades for the Earth to respond
fully to any change in greenhouse gas levels.
Thus, global warming is always much further along
than it appears. Unfortunately, for many of our
high elevation tropical glaciers their fate has
already been decided and the sentence is being
carried out. The only question is how long will
it take!
Recommended
CrystalGraphics Presentations


