
PCA Transformation images - PowerPoint PPT Presentation
Title:
PCA Transformation images
Description:
PCA Transformation images – PowerPoint PPT presentation
Number of Views:58
Title: PCA Transformation images
1
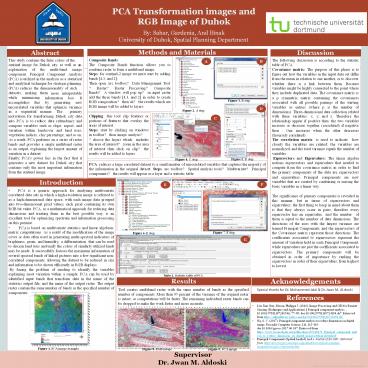
PCA Transformation images and RGB Image of
Duhok By Sahar, Gardenia, And Binak University
of Duhok, Spatial Planning Department
Methods and Materials
Discussion
Abstract
Composite Bands
This study contains the false colors of the
sentinel image for Duhok city, as well as an
The following discussion is according to the
statistic table of PCA. Covariance matrix The
purpose of this phase is to figure out how the
variables in the input data set differ from the
mean in relation to one another, or to discover
B
A
The Composite Bands function allows you to
combine raster to form a multiband image. Steps
for sentinel-2 image we must start by adding
bands 4,3, and 2. Then open Arc toolbox? Data
Management Tool
explanation of the multi-band
component. Principal Component
image Analysis
(PCA) is utilized in the analysis as a
statistical and analytical technique for
strategic planning. (PCA) reduces the
dimensionality of such
whether there is a link between them. Because
? Raster? Raster Processing? Composite
variables might be highly connected to the point
where they include duplicated data. The
covariance matrix is
Bands? A window will pop up? in input raster add
the three bands 4,3, and 2 in order to create
RGB composition? then ok? the results which are
RGB image will be added to layers.
more interpretable
datasets, making them while minimizing
information loss. It new
a p symmetric matrix containing the covariances
Figure 3. B step.
accomplishes this by generating
associated with all possible pairings of
the starting
uncorrelated variables that optimize variance
variables as entries (where p is the number of
D
Figure 2. A step.
in a sequential manner. The primary motivation
for transforming Duhok city data into PCA is to
reduce data redundancy and compare variables
such as slope, aspect, and
dimensions). Three-dimensional data collection
related
Clipping this tool clip features or portions of
features that overlay the areas of
interest. Steps start by clicking on windows in
toolbar? then image analysis? ?choose the layers
which includes the area of interest? zoom in
the area of interest then click on clip? the
results will be added to layers.
with three variables x, y, and z. Therefore the
relationship appear if positive then the two
variables increase or decrease together
(correlated) if negative
C
variation within landcover and land uses,
vegetation indices, clay percentage, and so on.
As a result, PCA performs on a series of raster
bands and provides a single multiband raster as
an output, explaining the largest amount of
variation in a dataset. Finally, PCA's power lies
in the fact that it generates a new dataset for
Duhok city that contains only the most important
information from the sentinel image.
then One increases when the other decreases
(Inversely correlated). The correlation matrix
is used to indicate how closely the variables
are related the variables are normalized, and
the total variance equals the number of
variables. Eigenvectors and Eigenvalues The
linear algebra notions eigenvectors and
eigenvalues that needed to compute from the
covariance matrix in order to find the primary
components of the data are eigenvectors
Figure 4. C step. Figure 5. D step. PCA reduces
a large correlated dataset to a small number of
uncorrelated variables that captures the majority
of the information in the original dataset.
Steps arc toolbox? Spatial analysis tools?
Multivariate? Principal components? the results
will appear as a layer and a statistic table.
and eigenvalues. Principal components are new
Introduction
variables that are created by combining or mixing
the basic variables in a linear way.
F
E
- PCA is a generic approach for analyzing multivaria
te
correlated data sets in which a high-resolution
image is referred to as a high-dimensional data
space, with each image data grouped into
two-dimensional pixel values, each pixel
containing its own RGB bit value. PCA, as a
mathematical approach for reducing data
dimensions and treating them in the best possible
way, is an excellent tool for optimizing
spectrum and information processing on this
premise.
The significance of primary components is
revealed in
this manner, but in terms of eigenvectors and
eigenvalues the first thing to keep in mind
about them is that they always occur in pairs,
therefore every eigenvector has an eigenvalue.
And the number of them is equal to the number
of data dimensions. The directions of the axes
with the largest variance are termed Principal
Components, and the eigenvectors of the
Covariance matrix represent those directions. The
coefficients associated to eigenvectors
represent the amount of variation held in each
Principal Component, while eigenvalues are just
the coefficients associated to
- PCA is based on multivariate statistics and
linear algebraic
matrix computations. As a result of the
modification of the image cover or data often
used in generating multi-spectral indicators of
brightness, green, and humidity, a
differentiation that can be used to discern
land uses and unify the colors of similarly
utilized lands may be made. It successfully
focuses the maximum information of several
spectral bands of linked pictures into a few
significant non- correlated components, allowing
the dataset to be reduced in size and
information to be shown efficiently in RGB
displays. By facing the problem of needing to
identify the variables explaining most variation
within a sample. PCA can be used by identified
input bands that transform data in the name of
the statistics output file, and the name of the
output raster. The output raster contain the
same number of bands as the specified number of
components.
Figure 7. F step.
Figure 6. E step.
G
eigenvectors. The primary components will be
obtained in order of importance by ranking the
eigenvectors in order of their eigenvalues, from
highest to lowest.
Table 1. Statistic table of PCA.
Acknowledgements
Results
Special thanks for Dr. Mohammed Jalal Dr. Jwan
M. Al.doski
Tool creates multiband raster with the same
number of bands as the specified number of
components. More than 95 percent of the variance
of the original raster is intact, so
computations will be faster. The remaining
individual raster bands can be dropped to make
the work faster and more accurate.
References
- Liu, Jian Guo Mason, Philippa J. (2016). Image
Processing and GIS for Remote Sensing
(Techniques and Applications) Principal
component analysis. , 10.1002/9781118724194(),
7789. doi10.1002/9781118724194.ch7. Retrieved
from https//onlinelibrary.wiley.com/doi/10.1002/9
781118724194.ch7
- Ng, S. C. (2017). Principal component analysis to
reduce dimension on digital
- image. Procedia Computer Science, 111, 113119.
doi10.1016/j.procs.2017.06.017. Retrieved from
https//www.researchgate.net/publication/319248454
_Principal_component_anal ysis_to_reduce_dimensio
n_on_digital_image/citation/download - Principal Components (Spatial Analyst) (n.d.).
Journal of ArcGIS . Retrieved - from https//pro.arcgis.com/en/pro-app/latest/tool
-reference/spatial- analyst/principal-components.
htm
Contact
Figure 1. PCA image example.
Figure 8. RGB image.
Figure 9. PCA image.
Supervisor Dr. Jwan M. Aldoski
Recommended
CrystalGraphics Presentations


