
Creating PDSA Storyboards - PowerPoint PPT Presentation
1 / 27
Title: Creating PDSA Storyboards
1
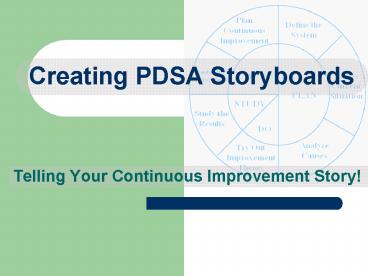
Creating PDSA Storyboards
- Telling Your Continuous Improvement Story!
2
What is a PDSA Storyboard?
- A graphical representation of continuous
improvement efforts - Purpose To communicate progress to stakeholders
- Includes meaningful artifacts, data and quality
tools - Is organized around the PDSA wheel
3
Plan Continuous Improvement
Define the System
Standardize Improvement
ACT
Assess Current Situation
PLAN
STUDY
Study the Results
DO
Analyze Causes
Try Out Improvement Theory
4
(No Transcript)
5
Define The System
- Tell stakeholders
- Why was the project chosen?
- Who are the customers of the system?
- What did you measure? Why?
- Tools may include flow chart, operational
definitions, data gathering plan, etc.
6
(No Transcript)
7
(No Transcript)
8
Assess The Situation
- Tell Stakeholders
- How big of a problem is it?
- Is the system stable?
- Were there special causes at work?
- What did the baseline data look like?
- Possible tools include check sheets, run
charts, pareto diagrams, etc.)
9
(No Transcript)
10
(No Transcript)
11
(No Transcript)
12
(No Transcript)
13
Analyze Cause
- Tell Stakeholders
- What were the most important root causes?
- What did you propose to improve the system?
- What was your improvement theory?
- Possible tools include cause and effect diagram,
relations diagram, improvement theory, etc.
14
(No Transcript)
15
(No Transcript)
16
(No Transcript)
17
Try Out Improvement Theory
- Tell Stakeholders
- What was your improvement theory?
- How did you try out the improvement theory?
- Did you have to adjust the plan?
- Possible tools include force field analysis,
action plan, etc.
18
(No Transcript)
19
(No Transcript)
20
(No Transcript)
21
Study the Results
- Tell Stakeholders
- Did the improvement theory work?
- How did the results compare to the baseline data?
- Possible tools include run charts, pareto
diagrams, etc.
22
(No Transcript)
23
Standardize Improvement
- Tell Stakeholders
- How will you hold the gains?
- How will get others to implement the improvement
theory? - Possible tools include newly created flow
chart, action plan, etc.
24
(No Transcript)
25
(No Transcript)
26
Plan Continuous Improvement
- Tell Stakeholders
- What will you recommend is done next?
- How will you sustain the positive changes?
- What further improvements could be made?
- What will we work on next?
27
(No Transcript)
Recommended
CrystalGraphics Presentations


