
Aerological diagrams - PowerPoint PPT Presentation
1 / 52
Title:
Aerological diagrams
Description:
At the ground, a highly directional radio direction finding antenna is used to ... by tracking the radiosonde and determining the azimuth and elevation angles. ... – PowerPoint PPT presentation
Number of Views:502
Avg rating:3.0/5.0
Title: Aerological diagrams
1
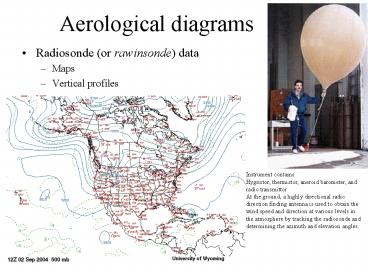
Aerological diagrams
- Radiosonde (or rawinsonde) data
- Maps
- Vertical profiles
Instrument contains Hygristor, thermistor,
aneroid barometer, and radio transmittor At the
ground, a highly directional radio direction
finding antenna is used to obtain the wind speed
and direction at various levels in the atmosphere
by tracking the radiosonde and determining the
azimuth and elevation angles.
2
Aerological diagrams
- Hydrostatic balance
- Ideal gas law
- Hypsometric equation
3
Aerological diagrams different types
emagram
4
Stuve
pressure
temperature
5
Stuve
6
Skew T log p
7
Fig 1d. Elements of a tephigram. First, the 5
lines are shown separately, and then they are
combined in the lower-right image.
8
tephi
9
(No Transcript)
10
Psychrometric chart
RH 100 e/es 100 r/rs mixing ratio r
mass of water vapor
mass of air r 622 e/p g/kg
e
11
(No Transcript)
12
- LCL (lifting condensation level)
- Applications
- Determine the height of the base of cumulus
clouds, given surface observations of T and Td - Determine the cloud base temperature
HLCL
ground
13
potential temperature
wet-bulb potential temperature
14
equivalent potential temperature
saturated equivalent potential temperature
15
Wet bulb energy balance LE H LE 6 u
esat(Tw)-e H 4 u T-Tw (Regnault balance)
16
(No Transcript)
17
Applications
1. Layer thickness (between po and p)
Dz
Dz 100 DT
18
2. Precipitable water
19
(No Transcript)
20
(No Transcript)
21
(No Transcript)
22
3. Chinook (Fohn) effect
23
east
west
Cascade Mountains
24
4. subsidence
25
(No Transcript)
26
5. Turbulent mixing, mixed layer (stratus), MCL
27
(No Transcript)
28
Oakland
29
Conserved or not conserved?
30
equilibrium level
severe
benign
LFC
no convection
convective inhibition
31
(No Transcript)
32
(No Transcript)
33
stability
34
Local vs non-local stability
35
Conditional vs absolute stability
Case II
qe
d
lt 0
dz
36
Absolutely stable
Conditionally unstable
Absolutely unstable
37
Typical wet-season tropical sounding
qe
d
lt 0
Conditional instability
dz
38
(No Transcript)
39
Latent instability
WLR wet-bulb lapse rate
deep convection source layer
40
Potential instability
or
Potential instability
41
Lifting a potentially unstable layer
42
Stability indices
43
Significant level indices
- TP Tropopause level (mb)
- THCK 1000-500 mb thickness layer-mean
temperature - WB0 Wet bulb zero, Tw 0C ideally 7-9,000ft
MSL, yet well below the FL - PWAT Precipitable water (mm) the higher the
better - LCL Lifting condensation level (mb, from surface
data) the lower the better - TOTL Total totals index T 850 Td 850 - 2T 500
(C) the higher the better, thunderstorms
probable when TOTLgt50 - Cross totals CTOT Td850 - T500 vertical totals
VTOT T850 - T500 - KINX K index T 850 Td 850 -T 500 -(T-Td)700
(C) the higher the better - SWET Sweat index or severe weather threat - the
higher the better, for severe storms, SWgt300 - SWET 12Td850 20(TOTL-49) 2U850 U500
125(0.2sinf) - where f wind direction 500 - wind direction 850
- U is expressed in kts and TOTL-49
is set to 0 if TOTLlt49 - MLTH and MLMR mean mixed layer (lowest 500 m)
potential temp and mixing ratio
44
PARCEL indices
Lifted index uses Actual sfc temp or Estimated
max sfc temp or Mean mixed-layer temp
45
Showalter index
46
PARCEL indices
- LIFT Lifted index (C, using surface data or 100
mb layer above surface) must be negative LI
T500 T parcel,near-sfc lowest 500 mb is often
used - LFTV lifted index, but Tv is used.
- SHOW Showalter index (C, as LI but starts from
850mb) must be negativeSHOW T500 T
parcel,850 - CAPE Convective available potential energy -
should be over 500J/kg - CAPV CAPE using Tv
- CINS Convective inhibition (external energy) -
ideally 100-300 J/kg - CINV CIN using Tv
- CAP Cap strength (C) Tenv -Tparcel _at_LCL - should
be lt5C - LFC Level free convection (LFCT and LFCT) (mb) -
should be close to the LCL - EQL Equilibrium level or level of neutral
buoyancy (EQLT and EQLV)(mb) - should be high - MPL Maximum parcel buoyancy level (mb) - level
where buoyancy (Tp-Tenv) is maximum
47
Wind parameters
- STM Estimated storm motion (knts) from
0-20,000ft AGL layer, spd 75 of mean, dir 30 deg
veer (to the right) from mean wind. - HEL Storm relative helicity 0-10,000ft AG (total
value) - SHR Positive shear magnitude 0-3000m AG (sum of
veering shear values) - SRDS Storm relative directional shear 0-3000m AG
(directional difference of storm relative winds) - EHI Energy helicity index (prop to positive
helicity CAPE) - BRN Bulk Richardson number 500-6000m AG (BRN
CAPE/.5BSHR2) - BSHR Bulk shear value (magnitude of shear over
layer), shear calculated between 1000-500 mb or
500 m 6000 m AGL
48
possible mid-term questions
- Some stability parameters, such as lifted index
and CAPE, can be calculated in terms of the
actual temperature T or virtual temperature Tv. - Which one is more representative of underlying
physical processes? Explain. - Assuming surface values T32C, Td22C,
T500-7C, calculate Tv at the surface, and the
lifted index LI based on both T and Tv. - Using a given sounding on a tephigram,
graphically determine, for an air parcel at 850
mb, the following Tw , r, rs, e, es, RH, q, qw,
qe, qe, - For the same sounding, determine the following
- SHOW
- TTOT
- PWAT (use finite difference technique described
in course handout) - CAPE
49
LIFT-7 K CAPE1974 J/kg CIN-24 J/kg LCL 900
mb LFL 836 mb
50
(No Transcript)
51
(No Transcript)
52
(No Transcript)
53
(No Transcript)
Recommended
CrystalGraphics Presentations


