
Fall line Air Quality Study - PowerPoint PPT Presentation
1 / 25
Title:
Fall line Air Quality Study
Description:
Cost: $2.8 million sponsored by GA EPD and GA DOT. Principal Investigator: Dr. Michael E. Chang ... for Additional Sources in the Augusta / Middle GA Area ... – PowerPoint PPT presentation
Number of Views:60
Avg rating:3.0/5.0
Title: Fall line Air Quality Study
1
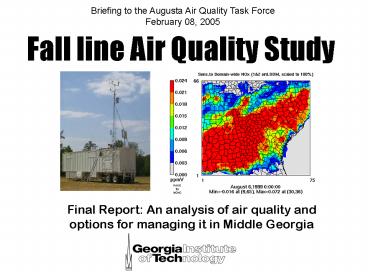
Fall line Air Quality Study
Briefing to the Augusta Air Quality Task
Force February 08, 2005
- Final Report An analysis of air quality and
options for managing it in Middle Georgia
2
About the FAQS
- Goal to provide all stakeholders with an
objective and unbiased evaluation of air quality
in Middle Georgia that they may use to develop an
effective and efficient plan for improving it. - Objectives to assess urban and regional air
pollution, identify the sources of pollutants and
pollutant precursors, and evaluate potential
solutions to realized and potential poor air
quality in the Augusta, Macon, and Columbus
metropolitan areas. - Methodology Field Studies, Modeling Studies, and
Cost Studies - Duration 44 months (May 2000 December 2004)
- Cost 2.8 million sponsored by GA EPD and GA DOT
3
FAQS A Mammoth Team Effort!
Principal Investigator Dr. Michael E.
Chang Co-Principal Investigators Dr. Armistead
Russell Dr. Karsten Baumann Investigators Dr.
Yongtao Hu Dr. Dan Cohan Ms. Di Tian Ms.
Rosa Chi Dr. Rodney Weber Dr. Michael
Bergin Dr. Doug Worsnop Dr. Carlos
Cardelino
Senior Advisors Dr. C. S. Kiang Dr. William
Chameides
many more!!
4
(No Transcript)
5
Ground-level OzoneFormation
Volatile Organic Compounds (VOCs)
Nitrogen Oxides (NOx)
Ozone (O3) Smog
Combustion Processes
Fuels, Paints, Solvents, Vegetation
6
Summary of FAQS NOx and VOC emissions inventories
for the year 2000 daily totals (in tons/day)
a. Includes Richmond, Columbia, Mc Duffie
counties of GA, and Aiken and Edgefield counties
of SC. b. Includes Muscogee, Chattahoochee, and
Harris of GA and Russell county of AL. c.
Includes Bibb, Houston, Jones, Peach, and Twiggs
counties of GA.
7
Daily maximum ozone on August 17, 2000 in
the 12-km grid (on the left) and in the 4-km grid
(on the right)
8
Summary of FAQS NOx and VOC emissions inventories
for the year 2007 daily totals (in tons/day)
a. Includes Richmond, Columbia, Mc Duffie
counties of GA, and Aiken and Edgefield counties
of SC. b. Includes Muscogee, Chattahoochee, and
Harris of GA and Russell county of AL. c.
Includes Bibb, Houston, Jones, Peach, and Twiggs
counties of GA.
9
Daily maximum ozone on August 17, 2000 in the
12-km grid (on the left) and in the 4-km grid
(on the right)
Daily maximum ozone concentrations in the 12-km
grid (on the left) and in the 4-km grid (on the
right) on August 17 when FAQS2007 emissions are
used
10
Estimated Change in Region Maximum of Peak 8-hour
Surface Ozone from August 17th, 2000 to 2007
under the Existing Federal Control Strategies
(ppbv)
Results shown for FAQS 4km grid
11
Current
Projected (assumes 10 benefit due to
full implementation of existing control strategy
for Atlanta and the region)
12
Daily maximum ozone on August 17, 2000 in the
12-km grid for FAQS2000, FAQS2007, and FAQS2012
Emissions
2000
2007
2012
13
Estimated Change in Region Maximum of Peak 8-hour
Surface Ozone from August 17th, 2000 to 2007 to
2012 under the Existing Federal Control
Strategies (ppbv)
Results shown for FAQS 12km grid
14
About Ozone Nonattainment in the Augusta Area
- By virtue of monitored ozone concentrations
(design value 0.083 ppm), the Augusta area is
currently meeting the National Ambient Air
Quality Standard (0.085 ppm). - FAQS modeling suggests that the Augusta area will
continue to attain the standard through 2012
assuming that existing control strategies are
fully implemented and that growth projections are
reasonable.
15
But what if Augusta desired to build in a
margin of safety?
- What are the most cost effective means to reduce
ozone concentrations?
16
Potential Controls for Point Sources in the
Augusta Area
17
Potential Controls for Point Sources in the
Augusta Area (Continued)
18
Potential Controls for Additional Sources in the
Augusta / Middle GA Area
19
Taken together, the menu of measures represents
the potential to control 20-35 of NOx and VOC
(not shown) in Georgia regions, but with marginal
costs increasing rapidly beyond 15-20 reductions
20
Emissions and Sensitivity of Ozone to those
Emissions in Augusta in 2007
21
Sensitivity (ppt/ton/day) of ozone at the Augusta
EPD monitor to incremental emissions(August 2000
Episode August 1999 sensitivities are similar)
22
Total annual cost (millions of Year 2000 U.S. )
of the least-cost strategy for each monitor as a
function of the amount of ozone reduced, based on
sensitivity analysis of the August 1999 and
August 2000 meteorological episodes, with Year
2007 projected emissions. For each monitor, the
curve represents the aggregate cost of
implementing measures from any of the regions in
order of cost-effectiveness until each level of
ozone reduction is attained.
23
To Reduce Ozone by 1 ppb
Least-cost 3.57 million
Augusta Only 5.02 million
Note The sensitivity of ozone in Augusta to
emissions in Augusta are likely understated. This
leads to costs that are overstated as more
controls are required to meet objectives.
24
? To Reduce Ozone by 2 ppb
Least-cost 30.35 million
? To Reduce Ozone by 3 ppb
Least-cost 294.86 million
25
Fall line Air Quality Study
- Final Report An analysis of air quality and
options for managing it in Middle Georgia
Complete Report and Executive Summary Available
at http//cure.eas.gatech.edu/faqs/finalreport
Send Questions and Comments to chang_at_eas.gatech.
edu
Recommended
CrystalGraphics Presentations


