
The Science Behind Clay Mineralogy and Regulations - PowerPoint PPT Presentation
1 / 30
Title:
The Science Behind Clay Mineralogy and Regulations
Description:
X-ray diffractometer - for crystalline minerals when greater than 5 to 10% concentration ... Picture of Diffractogram. Mineral ID. Quantify results. Pros and Cons ... – PowerPoint PPT presentation
Number of Views:122
Avg rating:3.0/5.0
Title: The Science Behind Clay Mineralogy and Regulations
1
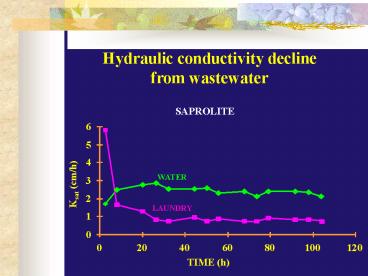
Hydraulic conductivity decline from wastewater
2
Infiltration rate decline from wastewater
Sandy Soil
3
Smectite (swelling 21 mineral)
Grain coating
(Borchardt, 1986)
4
Smectite low hydraulic conductivity micropore
network
(Borchardt, 1986)
5
11 Clay MineralsCEC 7 meq/100 gnon-expanding
6
11 Clay Minerals
7
21 Clay MineralsCEC 40 meq/100 gnon-expanding
8
21 Clay Minerals (expanding)CEC 100 200
meq/100 g (vermiculite) 70 120 meq/100 g
(smectite)
9
21 Clay Minerals
10
Laboratory Methods
- Direct methods ()
- XRD (all crystalline minerals)
- Infrared spectroscopy (mainly kaolinite)
- Thermal analysis (DTA) mainly kaolinite,
gibbsite) - Indirect methods
- Atterberg Tests
- COLE
- Bulk Density/Ksat
- CEC
11
X-ray Diffraction (XRD)
- Identifies minerals based on their crystal
structure (repeating planes of atoms), and
expansion and contraction of structure following
chemical and heat treatments.
12
X-ray diffractometer - for crystalline minerals
when greater than 5 to 10 concentration
100,000
13
soil
X-ray diffraction pattern
14
X-ray Diffraction (XRD)
- Pros and Cons
- Direct measurement of minerals
- Cost (175 - 300 for XRD cost for
time-consuming clay separation) - Time (2-3 day turnaround for XRD at commercial
lab, excluding separation time) - Detection limit (approx 5-10) exactly where
cutoff is in taxonomy - Semi-quantitative (approx. 10-20)
15
X-ray Diffraction (XRD)
- Identifies minerals based on their crystal
structure, expansion and contraction of structure
after chemical and heat treatments. - Define the results
- Picture of Diffractogram
- Mineral ID
- Quantify results
- Pros and Cons
- Direct measurement of minerals
- Cost
- Time
- Sensitivity (approx 10) exactly where cut is
in taxonomy - Semi-quantitative (approx. 10-20)
16
Apparent CEC
- Cation Exchange Capacity (CEC) definition Sum
of exchangeable bases (Na, K, Ca2, Mg2) plus
acidity (H, Al3) at a specific pH.
(from Soil Sci. Soc. Am., 1997). - However, direct extraction of soil cations cannot
distinguish between exchangeable cations and
cations dissolved from soluble salts.
17
Apparent CEC (contd)
- More accurate to first saturate soil with a
single index cation (NH4, Na, or Ba2), then
displace and measure the amount of that cation
adsorbed). - In practice, CEC is operationally defined by the
procedure used and tailored to the purpose for
which the results will be applied (measured CEC
depends on the method used).
18
CEC Method
NH4OAC Solution pH 7
clay platelet
water
NH4
NH4
NH4
Ca2
NH4
NH4
NH4
NH4
NH4
Na
NH4
NH4
NH4
NH4
NH4
Soil pH
NH4
Al3
NH4
NH4
NH4
NH4
NH4
NH4
NH4
NH4
NH4
Mg2
NH4
NH4
NH4
NH4
NH4
K
NH4
NH4
NH4
NH4
Na
NH4
NH4
NH4
NH4
H
NH4
NH4
NH4
19
H2O or alcohol
water
clay platelet
NH4
NH4
Ca2
NH4
NH4
NH4
NH4
Na
NH4
NH4
NH4
NH4
NH4
Al3
pH 7
NH4
NH4
NH4
NH4
NH4
NH4
NH4
Mg2
Na
NH4
NH4
NH4
NH4
NH4
NH4
H
NH4
K
NH4
NH4
NH4
NH4
NH4
NH4
20
NaOAC Solution pH 7
clay platelet
water
Na
NH4
Na
Na
Na
Na
NH4
Na
Na
Na
NH4
Na
Na
NH4
Na
Na
pH 7
Na
NH4
Na
Na
NH4
Na
Na
Na
Na
Na
NH4
Na
Na
NH4
Na
Na
Na
NH4
Na
Na
Na
Na
Na
NH4
Na
Na
Na
Na
Na
21
water
clay platelet
Na
Na
Na
Na
NH4
Na
NH4
Na
Na
Na
Na
Na
Na
Na
NH4
Na
NH4
pH 7
Na
Na
Na
Na
Na
Na
NH4
NH4
Na
Na
Na
Na
Na
Na
NH4
Na
NH4
Na
NH4
Na
Na
Na
NH4
Na
Na
Na
Measure displaced ammonium in the water (e.g.,
Kjeldahl)
22
Apparent CEC Methods
Soil Taxonomy Method
EPA Method 9081
- Wash soil with pH-7 NH4OAc solution to NH4
saturate the exchanger phase.
Wash soil with pH-8.2 NaOAc solution to Na
saturate the exchanger phase.
Rinse out dissolved Na.
Rinse out dissolved NH4.
Displace (w/ NH4) and measure exchangeable Na.
Displace (w/ Na) and measure exchangeable NH4.
Divide soil CEC by clay.
Divide soil CEC by clay.
23
Apparent CEC (contd)
- Because EPA Method 9081 is a pH 8.2 method
instead of a pH 7.0 method, it is NOT appropriate
for apparent CEC measurements tied a cutoff of
16.3 meq/100 g as used in soil taxonomy.
24
CEC increases with increasing pH
- (Data compiled by S. W. Buol)
25
Soil minerals have a range of CEC(chemical
compositions vary)
(typical CEC range in meq / 100 g mineral)
- kaolinite 2 15
- smectite 70 120
- vermiculite 100 200
- mica 10 40
- (organic matter) 150 300
- (Sparks, 1995)
26
Natural variation in chemical composition and CEC
of 47 soil smectites (Borchardt, 1989)
Increasing octahedral Al vs. Fe
CEC 110 ? 23 Range 47 162 meq / 100 g
Increasing tetrahedral charge vs. octahedral
charge
27
Basis for apparent CEC cutoff of 16.3 meq / 100 g
for 10 smectite
- Based in taxonomy to define kandic horizons
- Assumes kaolinite and smectite are dominant clay
minerals - Average CEC values used
- kaolinite 7 meq / 100 g
- smectite 100 meq / 100 g
- (90 kaol. x 7) (10 smect. x 100) 16.3
meq/100g
28
Range of apparent CEC for range of mineral CEC
- Low end (kaolinite 2 smectite 70 meq/100 g)
- (90 kaol. x 2) (10 smect. x 70) 9.8
meq/100g - High end (kaolinite 14 smectite 120 meq/100 g)
- (90 kaol. x 15) (10 smect. x 120) 25.5
meq/100g
29
Apparent CEC
- Pros and cons
- Reproducible and precise
- Relatively cheap (50)
- Based on the actual mineral properties that
relate to water movement. - Should not be used in soils lt 35 clay
- Should not be used on soils gt0.5 OC
- 16.3 meq/100g acec is based on ideal soil sample
containing only smectite and kaolinite - Most soil labs are not set up to run the correct
test
30
Assumptions in apparent CEC cutoff of 16.3 meq /
100 g
- (originally used in taxonomy to
- Show high end calculation
- 16.3 is mid point.
- Show range for different methods and pH.
Recommended
CrystalGraphics Presentations


