
Anthropometry - PowerPoint PPT Presentation
Title:
Anthropometry
Description:
... of school-aged children to be used in the design of playground equipment. ... Changes in diet and habit lead to changes in size and fitness of population ... – PowerPoint PPT presentation
Number of Views:7584
Avg rating:3.0/5.0
Title: Anthropometry
1
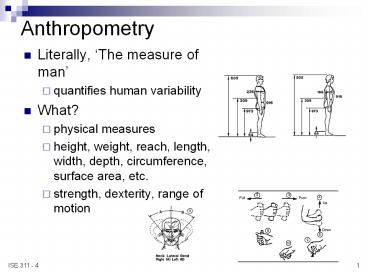
Anthropometry
- Literally, The measure of man
- quantifies human variability
- What?
- physical measures
- height, weight, reach, length, width, depth,
circumference, surface area, etc. - strength, dexterity, range of motion
2
Why?
- We are not all the same size.
- Exclude as few as possible
- Let the small person reach, let the large person
fit. - Poor design for mechanical abilities of the human
body can lead to discomfort or injury, e.g., the
height of keyboard for a computer. - Sources of Anthropometry Data
- Text
- Ergo software
- Tables in books in the HF/SQC lab (215)
- Online sources, e.g.
- http//mreed.umtri.umich.edu/mreed/downloads.html
ansur
3
Example Anthropometric Data
- Static Measures
- Passive measures of the dimensions of the human
body. - These measures are used to determine size and
spacing requirements of work space. - Example Measures
- arm length (e.g., your lab )
- height
- weight
- wing span
- seat to elbow height.
4
More Anthropometric Data
- Dynamic Measures
- Measures of the dynamic properties of the human
body, such as strength and endurance. - These measures are used to match the dynamic
characteristics of controls to user. - Measures
- range of motion for various joints
- force of leg pushes
- strength of fingers
5
How?
- Populations
- Tools techniques
- Statistical calculations
- based on central limit theorem
- typical calculations
- mean
- standard deviation
- percentiles
- from ordered data
- estimate for normal distribution
6
An Example
- A study was performed to determine key
anthropometric measures of school-aged children
to be used in the design of playground equipment.
Based on a sample size of 1050, the vertical
reach of 7-year old boys was found to have a mean
of 57.1 inches and a standard deviation of 3.3
inches. - 5th percentile ___________________ (z
______) - 50th percentile ___________________ (z
______) - 95th percentile ___________________ (z
______)
7
Using Anthropometric Data
- Know your population
- If your measures are from a different group than
your users are from problems could result. - Women are different from men.
- Asians are different from Europeans.
- Use Recent Data
- Changes in diet and habit lead to changes in size
and fitness of population - Most size measures are done on nude or lightly
clothed subjects. - clothes change our sizes
- think of seat belts in summer vs. winter.
8
Using Anthropometric Data
- Understand the task
- how will the system or device be used?
- reach, fit, strength requirements
- Cautions about adding segments
- every measure contains variability
- st2 s12 s22 s32
- the nth percentile person is not composed of nth
percentile segments
9
Using Anthropometric Data
- Refer to Table 2.10 on page 44 of your text.
- (Let the small person reach ) If you were
designing a console requiring a forward reach to
activate a control, what reach distance would you
use to define your maximum console depth? - (Let the large person fit ) What is the
minimum height of the bottom of the console if
the operator is seated?
10
Your turn
- In-class design problem (if we have time)
- Design a student desk chair for the engineering
school. Assume the student population mirrors the
general population. How do the tables and chairs
used in the building compare to your design?
Recommended
CrystalGraphics Presentations


