
Mikhail Tswett invented chromatography in 1901 while researching on - PowerPoint PPT Presentation
1 / 45
Title:
Mikhail Tswett invented chromatography in 1901 while researching on
Description:
Mikhail Tswett invented chromatography in 1901 while researching on ... The inset shows that square root of resolution is. proportional to the number of passes. ... – PowerPoint PPT presentation
Number of Views:732
Avg rating:3.0/5.0
Title: Mikhail Tswett invented chromatography in 1901 while researching on
1
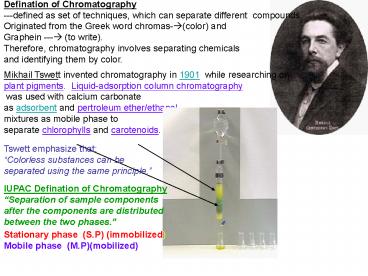
Defination of Chromatography ---defined as set
of techniques, which can separate different
compounds. Originated from the Greek word
chromas-?(color) and Graphein ---? (to write).
Therefore, chromatography involves separating
chemicals and identifying them by color.
Mikhail Tswett invented chromatography in 1901
while researching on plant pigments.
Liquid-adsorption column chromatography was
used with calcium carbonate as adsorbent and
pertroleum ether/ethanol mixtures as mobile phase
to separate chlorophylls and carotenoids.
Tswett emphasize that Colorless substances can
be separated using the same principle.
IUPAC Defination of Chromatography Separation of
sample components after the components are
distributed between the two phases.
Stationary phase (S.P) (immobilized) Mobile
phase (M.P)(mobilized)
2
Types of Chromatography
(M.P) GAS LIQUID
SUPERCRITICAL FLUID
liquid solid liquid
solid
liquid solid S.P
adsorbent bonded Column
Supercritical fluid (SFC)
bonded resin gel Plane Column
Bonded phase
(BPC)
adsorbent molecular sieve
adsorbent Plane
Column Thin Layer
Liquid (TLC) Solid (LSC)
Column Gas Liquid (GLC)
Column Column
Column Plane Liquid-liquid (LLC)
Column Gas Solid (GSC)
Ion Exchange
Size Exclusion (SEC)
3
Plate Theory of Chromatography
--Martin and Synge shared a nobel prize in 1952
on the development of the theory
Provides a theoretical treatment of zone
broadening and migration of solutes in a column
Physical Model Chromatographic column is
imagined to be sub-divided into individual
contact units
Imaginary boundaries between adjacent theoretical
plates
DVm
DVs
-?Each unit contains an amount of mobile phase
DVm and an amount of stationary Phase (DVs)
-? There are N units in the entire column (N
13) in the above example
-? These units are called Theoretical Plates
because S.P M.P equilibrium occurs in
each unit
4
Equilibration Process in Chromatography Column
1. Sample is added to the column and it enters
the first theoretical plates
M.P (mobile phase) S.P (stationary phase)
2. A fractional amount of p remains in the M.P
and fractional amount of q enters S.P
pq 1
3. Then, a small volume of M.P (DVm) is added and
a fraction of solute is transferred to next plate
(1st Transfer)
- After second equilibration the situation is
p x q pq q x p pq
p x p p2 q x q q2
(p q)2 p2 2pq q2
5
5. Another small volume of M.P is added and
fraction of solute is transferred to plate 3 (2nd
Transfter)
6. After third equilibration the situation is as
follows
pq pq 2pq 2pq x p 2p2q 2pq x q 2pq2
p x q2 pq2 q x p2 p2q
q2 xq q3 p2 x p p3
(p q)3 p3 3pq2 3pq2 q3
A. (p q)4 p4 4pq3 6p2q2 4p3q q4
6
As these transfer and equilibration process
continues, a pattern of solute distribution exactl
y like countercurrent distribution (CCD)
develops.
What is the difference between CCD and
Chromatography?
CCD-? contents of each tube is analyzed after
certain number of transfer (n)
Chromatography----? not each plate are analyzed,
but the contents of the Nth Plate are analyzed
by the detector
7
Calculation of Zone Spreading
The fractional amount of solute in any plate r
after the addition of a volume fraction (DVm) of
the mobile phase (M.P) can be calculated using
Bionomial Expansion
In chromatography, n and and r both take very
large values. However, since the M.P passes
through the column, lots of mobile phase volumes
are required to elute a compound, therefore
n gtgt r
qn-r qn (1-p)n e-np
_______________(b)
Substitiution of equation a and b into 1 yields
Equation (2) can be simplified further by using
Sterlings approximation
r! 2pr rr er
8
Thus, an equation with all factorial terms
removed is obtained
Fr,n (np)r e-np er
(3)
2pr rr
If we denote the plate containing the largest
fraction as rmax, Eq(3) can be used to calculate
the solute fraction at the zone maximum or top of
the chromatographic peak
If rmax r np, this value can be substituted
in Eq (3) to give
F(rmax, n) 1
2prmax
Now consider a situation in which the solute is
at the end of the column, i.e., rmax N
If n moles of solute is introduced to the column,
the quantity of material (QN,n) in the Nth
theoretical plate is given by the following
equation
Q (N,n) F(N,n) x m m
_________(4)
2pN
If the solute moves through the column of N
plates in time tR , its rate of movement is
N/tR
(plates/unit time) As that peak leaves the
chromatographic column, the maximum rate of
solute escape (Smax) will be Smax Q(N,n)
N/tR (moles/plate)(plate/unit time)
moles/unit time_______(5)
9
Substituting the value of QN,n from Eq(4) into
Eq(5) we get Smax Nm
1/tR _____________(6)
2pN The above equation(6) can be solved for
N N 2p(Smax)2 tR2 ------------(7)
m2
The quantity m (moles introduced into the
column) is proportional to the peak area m a
peak area --Increasing m, increases peak
area --Peak area ½ htw h peak height in
(mV) tw width of the peak at base(sec)
We can write an expression for m
m ½ khtw _____________(8) k
proptionality constant moles mv-1 sec-1
The maximum rate of solute escape is proportional
to the peak height i.e.,
Smax a h or Smax kh _____________(9)
Substitution of Eq(8) into Eq(7) we get N
2p(kh)2tR2
8p(tR)2 _______(10) (1/2 khtw)2
tw2
The above equation (10) can be used to calculate
N value for a triangular peak shape
10
If we replace the assumption of a triangular peak
shape with a more realistic Gaussian peak shapes
(as shown below) we obtain N 16 (tR/tw)2
________(11a) where tR is the retention tw is
the peak width
Distribution of solute molecules at its mean
position
Recasting Eq 11a by substituting tw 4s, we can
rewrite N (tR/s)2 ________________________(
11b)
11
Concept of HETP and its relationship with N
The efficiency of a column is best judged by H or
HETP (Height Equivalent theoretical plate), which
is given by a simple relationship H L
N
L column Length
At a fixed column length more plates results in
smaller plate height and better separations as
illustrated below
According to Eq (12) A decrease in plate
height or increase in L increases efficiency
Substituting for N from Eq 11(b) we obtain
N (tr)2
H Ls2
(s)2
tR2
12
SHORTCOMINGS OF THE PLATE THEORY ---According to
the plate theory (1) The partition
coefficient(K) is constant and is independent of
solute concentration in the stationary phase (Cs)
and the mobile phase (CM), and a plot of Cs vs.
CM is linear with a slope equal to K called
Isotherm.
Larger K----? greater affinity of Solute for S.P
In reality, peaks are not gaussian and we
can have two situations Tailing
Overloading or Fronting
Cs
13
What causes peak tailing? --- Strongly polar (OH
groups) present on S.P that retain solute more on
polar sites than the other sites ---Solute/S.P
interactions gt solute/solute interactions
What causes fronting? ---Injection of excessive
amount of solute to the column ---Solute/S.P
interactions lt solute/solute interactions
14
Shortcomings of the Plate Theory of
Chromatography (Contd)
2. Equilibrium is rapid compared to the movement
of the mobile phase
Not true because Diffusion is never
instantaneous. At high M.P flow rate, solute
swept before equilibrium is complete
- Spreading of the chromatographic zone by
longitudinal diffusion from one theoretical
plates to another - does not occur.
? In other words diffusion does not occur at all
Not true becauseAt low M.P flowrate
longitudinal diffusion does occur, because M.P
constituents have enough time to drift aimlessly
from plate-to-plate ----? resulting in Band
Broadening
4. Column is assumed to consists of a number of
discrete volume units.
This is again not true
5. Mobile phase is added in discrete volume units
(DVm)
This assumption is not true because Mobile phase
flows through the column in continous fashion
- Important variables excluded in the plate theory
are - mobile phase velocity (b) dimension of phases
- Principal Weakness of Plate TheoryFailure to
consider physical processes, which actually
occurs during separation
15
(No Transcript)
16
Partition Coefficient K
Distribution of a solute between M.P (liquid or
gas) and S.P (immoblized viscous liquid) on an
inert solid support
Migration rates are dependent on the magnitude of
of the equilibrium constants for the reactions by
which the solutes distribute themselves between
the mobile and stationary phase. K Cs / Cm
where Cs molar concentration of the solute in
the stationary phase and Cm molar
concentration of the solute in the mobile
phase K is often referred to as the distribution
coefficient, partition coefficient, or partition
ratio
17
Migration Rates of Retained and Unretained
Solutes(Retention Times and Dead Time)
The time it takes after sample injection for an
analyte peak to reach the detector is called
retention time. tR L / n or n L/tR where
tR is the retention time
(Taken from Skoog, 200x)
The time it takes for unretained solute to pass
through the column is called dead time (t M).
Typical dead time markers are air, CH4 in GC and
nitrate (NO3)- in HPLC. tM L / u or
u L/tM Adjusted retention time tR
tR-tM
18
Migration Rates of SolutesThe Relationship
Between Retention Time and Distribution Constant
In order to relate the retention time of the
solute to its distribution constant, we express
its migration as a fraction of the velocity of
the mobile phase. n u x fraction of time solute
spends in mobile phase
This fraction, is actually equal to the average
number of moles of analyte in the M.P at
any instant divided by the total number of moles
of analyte in the column
Since moles Conc x volume we can write
Multiplying and dividing Numerator and
denominator by CMVM
capacity factor or
retention factor k Tells us
how much solute is retained compared to
unretained component
19
Migration Rates of SolutesRelative Migration
Rates Selectivity Factor
A fraction consisting of of the partition ratios
of two retained species on a chromatographic
column by convention the ratio of the more
strongly held species (KB,the species that takes
longer to elute) is in the numerator. By this
definition a is always greater than 1.
a
KB/KA a kB /
kA a (tR)B -
tM / (tR)A tM
-? Greater the difference in (tR)B and (tR)A as
well kA and kB, higher will be the selectivity
? Selectivity values are greater in HPLC than in
GC
20
Column Resolution
- Resolution (RS) of a column provides a
quantitative measure of its ability to separate
two analytes - Mathematically resolution between neighboring
peak is defined as equal to the peak separation
i.e., difference in retention times (Dtr)
divided by the average peak width (measured at
the base)
Rs 1.5 (baseline separation) Ragt 1.8 (too much
separation, leading to long analysis time
21
Rs a vN a vL
Resolution is proportional to square root of
N.and L Therefore, doubling the column length
increases resolution by v2.
Figure to the right shows effect of column length
on Rs of L-phenylalanine and its deuterated
isomer. The Sample was recycled from the same two
columns over and over again. After one pass the
a 1.03, but after 15 passes baseline separation
has been achieved. The inset shows that square
root of resolution is proportional to the number
of passes.
Preparative Chromatography large scale analysis
(gt10 mg) --To isolate or purify significant
amount of one or more components --Short and Fat
columns are used to handle large quantities of
sample (long columns are expensive to buy and
operate and require space --Rs is poor
22
Importance of Resolution in Chemical Analysis
(Contd) If you develop a chromatographic
procedure to separate 2 mg of a mixture on a
column with a diameter of 1.0 cm, what size
column diameter should you use to separate 20 mg
of the mixture?
Rule for Scaling up Maintain same column length
and increase the cross-sectional area This is
because cross sectional area a Mass of
the analyte
Scaling equation large load (g)
large column radius small load (g) small
column radius
0.020 g x (cm)
1.58 cm r d/2 ½
0.5 0.002(g) 0.50 cm
Since D 2r 3 cm
Does that effect the speed of analysis?
Yes, it does because Volumetric flow rate a
cross-sectional area of the column -?Suppose a
small column has a flow rate of 7 ml/min. What
flow rate should be used to have same speed of
analysis
large column flow rate large
column radius small column flow rate
small column radius
70 mL/min about 10 fold higher
23
Peak Assymetry ---Measured at 10 of the peak
height as shown below ---Assymetry factor (As)
can be expressed as As
BC/CA Where BC and CA are measured at 10 of
the total peak height
If As gt1 means BCgtCA peak
tailing If Aslt1 means ACgtBC
peak fronting
10 of peak height
If As 1 symmetrical peaks
Time
24
What are the causes of peak tailing?
---Unfavorable interaction between the
sample stationary phase (as shown on the
right), which is due to the poor silanol
chemistry --Poor column packing also cause tailing
What are the causes of peak fronting? --Too much
sample injected --Poor injector design and set-up
25
Peak Capacity (PC) The peak capacity of a
column has been defined as the number of peaks
that can be fitted into a chromatogram between
the dead point and the 'last peak', each peak
being separated from its neighbor by 4s.
-? Larger the tr/tm greater will be the PC -?
if k gt10 --? results in long separation time,
the above equation is then only a
resaonable Approximation for PC. -?-? If k is
small (klt5) the above equation gives PC which is
too low.
-? N shows only a weak dependence on PC.
However, column with higher values of N are more
likely to separate complex mixtures.
26
Effect of Efficiency, Selectivity Factor and
Retention Factor on Column Resolution
At fixed a, N ------? Increase in kB, increase
Rs
At fixed kB, N ------? Increase in a, increase Rs
At fixed a, kB ----? Increase in N, increase Rs
Improvement in Rs for increasing N is not as
dramatic as for increasing a
27
- Efficiency in terms of capacity factors,
resolution, and selectivity factors
28
--Overall peak broadness is measured in terms of
peak width. Therefore, peak width can be
measured at different points in a chromatogram
as shown to the right
- Inflection Point (2s) ( s) When a peak width
- is measured at inflection point (i.e., 60-70
- of the peak height----? This width represents
68 - of the molecule in a band.
(II) Half Height (2.355s) When peak width is
measured at 50 of the peak height--? This width
represents 80 of the molecule in a band.
(III) Near Baseline (4s) (2s) When peak width
is measured at 13.4 of the peak Height ----?
This peak represents 95.5 of the molecule in
band.
- At the Baseline (6s) (3s) When peak width
- is measured at 2.4 of the peak height-?
- This peak represents 99.7 of the molecule in
- a band.
29
RATE THEORY OF CHROMATOGRAPHY
Imp to realize that details of the model are not
used on daily basis. However concepts in it ares
used when thinking about How to run better
separations? What conditions are needed to vary
to obtain better separation?
--Developed by a group of Dutch chemical
engineers, J. J. Van Deemter, F.J Zuderweg and
A Klinkenberg in 1954 --Developed initially for
packed column GC. However, because of its
generality, it has readily been extended to all
other types of chromatography Model of Rate
Theory The model focuses on the contribution of
various kinetic factors which results in band
broadening
Recall H L/N L16(wb/tR)2 H is a measure of
the ratio of bandwidth and retention time
In a simplified form the model equation can be
written as H A B/u
Cu
Easiest way to minimize H is to optimize M.P
velocity
A contribution to zone broadening deu to Eddy
Diffussion
B contribution to zone broadening due to
Longitudinal Diffusion
C contribution to zone broadening due to
resistance to mass transfer in both S.P and M.P
30
H A B/u Cu
Van Deemter Equation
What does the obove Van Deemter Equation tells
us? -? H is inversely proptional to to M.P
velocity when it is associated with B -? H is
directly propotional to M.P velocity when it is
associated with C
Plot of Van Deemter Equation
A is constant and is independent of M.P velocity,
but depends on S.P Properties, A 0 for open
tubular column
At u 0, B/u is largest ----? B/u decreases with
increase in u At u 0, Cu is zero,-------?
increase in C, with increase in u
There must be a minimum value of H, at some
value of u and the u value at which minima Occurs
is called optimum velocity, the optimum velocity
depends onf vlaue of B and C
31
In practice how the x and y values of Van
Deemter Plot is determined experimentally?
32
More on Van-Deemter Plot
Why in the Van Deemter Plot the plate height
increases (i.e., efficency decreases at low flow
rate?
---? Solute spend long time on the column (at low
flow rate) and is broadened by longitudinal diffus
ion i.e., B term increases
Why in the Van Deemter Plot the plate height
increases (i.e.,efficiency decreases) at high
flow rate?
--?Not enough time for solute to equilibrate
between M.P S.P, therefore, C, the mass
transfer is poor (increases) due to high mobile
phase velocity
Comparison of mobile phase flow rate on the
Plate height for LC and GC
If minima for HPLC occurs at low flow rates than
GC but why peaks are broader in HPLC than GC?
This advantage is offset by the fact that
HPLC column are much shorter in length (L 25-50
cm) compared to GC column (H L/N)
This brings the next question Why longer columns
cannot be used in HPLC?
Due to high pressure drop it is impractical
to get column longer than 50 cm in HPLC
33
- A Deeper Look at The Van Deemter Equation
- The A term (Eddy Diffusion) Two major reasons
for Eddy Diffusion are - (a) Multipaths paths adopted by sample molecules
(b) Stagnant pools of M.P retained in S.P
- Multiple paths adopted by sample molecules during
elution - If a column is packed inhomogeneously, solute
molecules - travel in several paths, which may differ in
length. - Thus, solute molecules when injected
simultaneously but - they elute at different times. In the digram to
the left, the - molecule 2 at the end of the column (point B)
would - arrive later than molecule 1.
Non-homogenous packing of S.P is the main reason
for Multiple paths.
(b) Stagnant pools of M.P retained in the S.P
-?The pores of a poorly packed column are
filled with static volume of M.P
- A term is significant for poorly-packed column,
but - is not significant for a well-packed GC column
and for GC capillary columns
34
Dependence of A term on the size of stationary
phase particles. A term is independent of mobile
phase velocity but it depends on the stationary
phase particles, which may be Inhomogenously
packed.
So what causes inhomogenous packing of the S.P?
- particle size or particle diameter (b) packing
consistency - H A B/u Cu
Hp A 2ldp - dp particle diameter
- packing consistency,depends on particle size
distribution, - the narrower the distribution the smaller the l
- The smaller the particle size, the smaller the A
term
Good separation and minimum band-broadening will
be achieved using small particles with
narrow size range that are uniformly packed.
35
(2) The B Term (Longitudiinal Diffusion)
What is diffusion?
Random motion that tends to spread molecules
uniformly
What is longitudinal diffusion?
Forward and backward diffusion of solute
molecules in mobile phase as the solute band
moves along the column.
-?Longitudiinal diffusion takes place along
the column axis and parallel to the movement of
the mobile phase
?This forward and backward diffusion of
solute Molecules in M.P will let some molecules
move ahead while others lag behind the band center
Why is the B-Term inversely proportional to
mobile phase velocity?
---When the M.P flow rate is faster, the
time Bbetween injection and the detection of
solute is shorter --Therefore, shorter the time,
the less chance the solute Molecules get to
wobble back and forth along the column axis.
Thus, molecules have less time to spread out by
longitudinal diffusion
36
More on B Term Mechanism of Longitudinal
Diffusion
The above examples shows that at (a) Initial
Time sample molecules are together as a sharp
band
(b) Intermediate Time Molecules have spend some
time in S.P and diffuse randomly
(c) Final Time Longer time spend in S.P, which
results in more diffusion and increase band with,
decreasing efficiency
37
Mathematical Description of Longitudinal Diffusion
- H A B/u Cu
- Hd B/u 2gDM/u
- is related to the diffusion restriction of packed
columns, with packed columns this value is about
0.6 and 1 for open tubular columns - (aka. obstruction factor)
- DM is the mobile phase diffusion coefficient and
is directly proportional to the B/U
B term is smaller for HPLC than for GC. Why?
38
(2) The C Term (Resistance to Mass Transfer)
Cm Resistance to Mass Transfer in the Mobile Phase
Cm resistance to mass transfer in the mobile
phase Cs resistance to mass transfer in the
stationary phase
Band broadening also occurs if there is a slow
equilibration of solute between the S.P and the
M.P. This process is called mass transfer
The above equation suggest that increasing the
particle diiamater decreases the C term,
thus Decreasing N. Increase in DM increases the
CM Term
Thus, a contribution to band broadening occurs
when solute movement to the interface ( (present
between the two phases)is not fast enough to
maintain a true equlibrium between the phases.
Particles of S.P offers a resistance to the flow
of M.P molecules.
39
Cm Resistance to Mass Transfer in the Stationary
Phase
---The adsorption/desorption process of the
analyte to and from the S.P is usually slow at
high M.P velocity resulting in poor mass transfer
to and from the S.P
Liquid Coated on a Solid Support
adsorption
M.P
solute
desorption
Solid Support
--Mathematically, the Cs term takes different
forms for different types of dhromatography --In
GLC Gas (M.P), Liquid coated on a solid support
(S.P), the Cs term is
40
Why is Longitudinal Diffusion is inversely
related whereas mass transfer is directly
proportional to the flow rate of the Mobile Phase?
Longituidinal diffusion arises because solute
molecules moves in a direction Parallel to the
mobile phase flow as shown below
41
Putting it All Together!
- Summary of Van-Deemter Plot and Equation
- A or Hp term is independent of mobile phase
velocity (u) - B or Hd term is inversely proportional to the
mobile phase velocity (u) - Cm(Hm) and Cs (Hs) terms are directly
proprortional to the mobile phase velocity (u) - A, B and C term for a column can be obtained by
calculating H for different settings - of M.P velocity . Then
- (a) The value of A, B and C can be obtained from
the plot of H vs. u (shown on - earlier pages)
- (b) H and u are substituted in the Van Deemter
Equaton to give three simultaneous - equations that can be solved for A, B and C
42
More Informaton on Optimum Mobile Phase Velocity
--We know that optimum mobile phase velocity
occurs at Hmin
--When it is important to obtain the maximum
number of theoretical plates in a
given Separation, the optimum flow rate can be
quite accurately found --According to the Van
Deemter plot the A term is independent of M.P
velocity. Hence Golay in 1958 proposed an
alternative term for Van Deemter Equation
which can be writted as follows
H B Cu (also applicable to OTC)
u
--Since we desire to minimize H by choosing some
optimum flow rate, the above Equation can be
diferentiated (with respect to u) and then set
equal to zero dH
B C 0 dx
uopt
Note the differential equation shown involves
calculus, which is used to drive the
last Equation. However, the goal of the course
is to understand the physical meaning of The
above expression and its application.
43
Example Illustrating the application of uopt
equation (see previous page) On a certain
column, with helium as the carrier gas, the
following values of the Van Deemter terms were
found A 0.10 cm, B 0.35cm2/sec and C
0.06 sec
Solution HETP (H) A B/u Cu (for
u 1 cm/sec 0.10cm 0.35
cm2/sec ( 0.06 sec)(1.0 cm/sec)
0.51 cm/plate
With nine more calculation similar to the one
shown above the following Table is constructed
44
From the above Table the following plot is
constructed
M centimeters/second
45
--This calculated value of u is close to the
graphically established value of about 2.5
cm/sec. Remember that a value is established
graphically from French curve extrapolations. An
u uncertainty in it is 0.1 cm/sec would not be
surprising