
Optical Survey of Scallop Abundance and Benthic Habitat - PowerPoint PPT Presentation
1 / 43
Title: Optical Survey of Scallop Abundance and Benthic Habitat
1
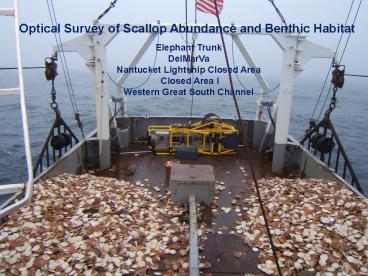
Optical Survey of Scallop Abundance and Benthic
Habitat Elephant Trunk DelMarVa Nantucket
Lightship Closed Area Closed Area I Western
Great South Channel
2
2008 Objectives and Accomplishments 1. Relative
dredge efficiency and variability in multiple
scallop resource areas 100 tows, joint ship
operations with R/V Hugh Sharp 2. Scallop
resource conditions in closed area I Compare
survey designs- time, cost, accuracy grid,
zigzag, spiral 3. Scallop resource conditions
in Western Great South Channel HAPC using both
HabCam and AST acoustics (175 kHz side scan)
50,000,000 m2 AST imagery, 85 linear
nm 100,000,000 m2 in other regions
3
Methods Merge synoptically acquired optical and
acoustic benthic data with water column data
Kongsberg EM3002 300 kHz multibeam
175 kHz AST Synthetic Aperture Side scan VPR,
CTD, Fluorometer on Focus vehicle
Imagenix 600 kHz side scan
Stereo optical imaging
30m
3m
VPR, CTD, Fluorometer
4
Integration of multi-resolution imaging
modalities
300 kHz Multibeam 300 m swath 2 m resolution
175 kHz synthetic aperture side scan, 200m
swath 5 cm resolution
600 kHz side scan 50 m swath 2 cm resolution
CCD 1 m swath 1 mm resolution
5
0.68 inch fiber optic tow cable
Machine vision digital stereo video cameras
Fiber optic telemetry bottle
Benthos Altimiter
SBE 37 CTD
RDI 1200 kHz ADCP
2 Imagenix side scan sonars Teledyne Benthos C3D
side scan sonar
Strobe
Strobe
x4
2 - 3 m altitude typical
HABCAM Habitat Mapping Camera System
Stereo 2 Mpixel system
1m Field of View 5 10 frames per second gt50
overlap _at_ 5kts
6
(No Transcript)
7
Stereo optics with Teledyne Benthos C3D 200 kHz
sidescan
Stereo camera and c3d
8
Comparison between dredge and continuous imaging
surveys
- Conduct continuous imaging survey
- 5 images/s _at_ 5 kts
- 2700 m2/ 15 min tow
- 259,200 m2/ day
- 2.5X greater ground coverage
- Standard dredge survey
- 15 min tow _at_ 3.8 kts 4,500 m2
- 24 tows/24h period, on average
- 106,704 m2/day
1m
50 overlap to allow object registration for
mosaicing
1m
2 Terabytes / day
9
Elephant Trunk January 2006
The Challenge Automated segmentation and
classification
10
Original image
Fine scale segmentation
Aggregate polygons to course scale
Frequency distribution of all polygon areas
Substrate grain size
11
2007
Dredge efficiency 34 on average
12
- Imaged 2 million m2
- in each site so far
- Combination of RSA
- and NEBO cruises
SBNMS
CLAII
CLAI
WGSC
NLS
11/25/2008
ET
13
Elephant trunk 44 joint tows 3 -7 passes
DelMarVa 7 joint tows 3 passes
14
Strata 6150 Station 91 Tow 20
15
(No Transcript)
16
Closed Area II HAPC 8 joint tows 1-5 passes
17
Strata 6710 Station 405 Tow 8 5 passes
18
(No Transcript)
19
Closed Area I
20
Nantucket Light Ship Closed Area 9 joint tows 1-3
passes each
21
Western Great South Channel 17 joint tows 1-3
passes
22
(No Transcript)
23
(No Transcript)
24
(No Transcript)
25
(No Transcript)
26
(No Transcript)
27
Close Area II HAPC
28
Western Great South Channel
29
Nantucket Light Ship
30
DelMarVa
31
DelMarVa
32
DelMarVa
33
Elephant Trunk
34
(No Transcript)
35
Y 0.27 X 0.01
36
Plans for 2009 Operations
- Goals and Objectives
- Scallop resource conditions in the ET, DMV,
NLSCA, and CLAI scallop access areas using a
newly - designed optical sampling survey,
- 2. Relative dredge efficiencies and variability
in multiple scallop resource areas in operations
with the - R/V Hugh Sharp,
- 3. Scallop resource conditions and substrate
characteristics in the HAPC area, now designated
in the - Western Great South Channel (approximately 260
km (260,000 m2) of images )
37
Objective 1, Details of Surveys in Scallop
Resource Areas Survey ET, DMV, NLSCA, and CLAI
areas using zigzag design 100 Federal survey
stations in ET providing 100 nm of sampled
trackline Zigzag optical survey will cover 320 nm
(600,000 images) and be completed in 2.6
days DMV zigzag survey is 212 nm in length
(400,000 images) and will be completed in 1.8
days CLAI zigzag survey is 165 nm long (305,000
images) and will be completed in 1.8 days NLSCA
survey is 203 nm (375,000 images) and will be
completed in 1.7 days For each of these areas,
the proposed HabCam survey will cover
approximately 5 times the total surface area
surveyed in 2008 by the Sharp. One 6 day trip
will be made to ET and DMV and a second 6 day
trip to CLAI, NLSCA, and WGSC.
38
Objective 2 Relative dredge efficiencies and
variability in multiple resource areas R/V Hugh
R. Sharp using NEFSC survey dredges with HabCam
onboard 3 leg of scallop survey June 22 July
3 CLAI, CLAII, SE Part Continue with joint ship
operations with F/V Kathy Marie is all 50 tows
can not be made
39
Objective 3. Scallop survey and substrate
characterization of the proposed HAPC in Western
Great South Channel 135 linear nm survey area of
250,000 m2
40
(No Transcript)
41
(No Transcript)
42
(No Transcript)
43
(No Transcript)
Recommended
CrystalGraphics Presentations


