
UKPDS 33: study design - PowerPoint PPT Presentation
1 / 14
Title:
UKPDS 33: study design
Description:
Diet alone (n = 1138) Conventional therapy. Intensive therapy ... and glycaemic control. Adapted from: UKPDS Study Group 1998. Diet and exercise. Oral agents ... – PowerPoint PPT presentation
Number of Views:951
Avg rating:3.0/5.0
Title: UKPDS 33: study design
1
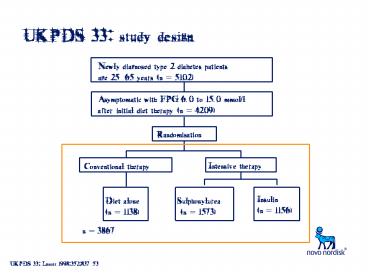
UKPDS 33 study design
Newly diagnosed type 2 diabetes patients age
2565 years (n 5102)
Asymptomatic with FPG 6.0 to 15.0 mmol/l after
initial diet therapy (n 4209)
Randomisation
Intensive therapy
Conventional therapy
Insulin(n 1156)
Diet alone (n 1138)
Sulphonylurea (n 1573)
n 3867
UKPDS 33 Lancet 199835283753
2
UKPDS 33 participant characteristics
UKPDS 33 Lancet 199835283753
3
UKPDS 33 treatment conditions
- Intensive group
- Aim FPG below 6.0 mmol/l
- Dietary advice
- Insulin patients
- pre-meal glucose of 47 mmol/l
- Once daily basal insulin
- Short-acting insulin added if necessary
- Blood glucose monitoring encouraged
- SU patients
- Daily doseschlorpropamide 100500 mg
glibenclamide 2.520 mg glipizide 2.540 mg
- Conventional group
- Aim FPG below 15 mmol/l without symptoms of
hyperglycaemia - Clinic visits every 3 months
- Dietary advice
- If marked hyperglycaemia occurred, patients were
randomised to additional therapy with insulin, SU
or metformin
UKPDS 33 Lancet 199835283753
4
UKPDS 33 intensive therapy reduced HbA1c
Intensive policy, median HbA1c 7.0
Conventional policy, median HbA1c 7.9
Median HbA1c ()
Years from randomisation
Dashed lines indicate patients followed for 10
yearsSolid lines indicate all patients assigned
to regimen
Adapted from Lancet 199835283753
5
UKPDS 33 intensive therapy reduced microvascular
events
Patients with microvascular events ()
Years from randomisation
Adapted from Lancet 199835283753
6
UKPDS 33 relative risk reduction with intensive
treatment
Intensive treatment reduced HbA1c by 0.9 for a
median of 10 years in 3,867 patients with type 2
diabetes p lt 0.05 p lt 0.01
Relative risk reduction for intensive treatment
()
Lancet 199835283753
7
UKPDS 35 any 1 decrease in HbA1c was associated
with risk reduction
Amputation/Death from PVD
Microvascular endpoint
All-cause mortality
Diabetes death
MI
Stroke
0
10
20
Relative risk reduction per 1 decrease in HbA1c
()
30
40
50
UKPDS 35 BMJ 200032140512
8
Progressive loss of beta-cell function and
glycaemic control
Median HbA1c ()
Years from randomisation
Dashed lines indicate patients followed for 10
yearsSolid lines indicate all patients assigned
to regimen
Adapted from UKPDS Study Group 1998
9
UKPDS 57 over time increasing numbers of
patients required insulin
Patients requiring additional insulin ()
Adapted from Diabetes Care 2002253306
10
UKPDS 57 patients refusing insulin
Patients refusing additional insulin ()
UKPDS 57 Diabetes Care 2002253306
11
UKPDS 33 intensive therapy was associated with
weight gain
Actual therapy
10.0
Mean change in weight (kg)
Dashed lines indicate patients followed for 10
yearsSolid lines indicate all patients assigned
to regimen
Adapted from Lancet 199835283753
12
UKPDS 33 intensive therapy was associated with
hypoglycaemia
Patients ()
Years from randomisation
Adapted from Lancet 199835283753
13
UKPDS 33 HbA1c was associated with severe
hypoglycemia
Rate of severe hypoglycaemia per 100 patient
years
HbA1c ()
UKPDS 33 Lancet 199835283753
14
Economic analysis - UKPDS
- Our economic analysis shows that the additional
costs of intensive management are largely offset
by significant reductions in the costs of
treating complications of diabetes.
UKPDS 41 BMJ 2000320137378
Recommended
CrystalGraphics Presentations


