
Published by AAAS - PowerPoint PPT Presentation
1 / 12
Title:
Published by AAAS
Description:
... to samples binned by altitude and averaged over different seasonal intervals ... predicted mean vertical CO2 gradients for the same seasonal intervals as Fig ... – PowerPoint PPT presentation
Number of Views:33
Avg rating:3.0/5.0
Title: Published by AAAS
1
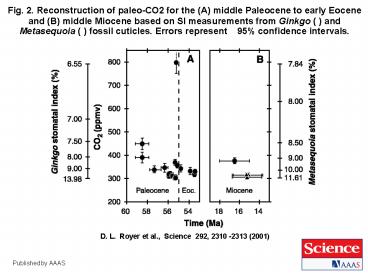
Fig. 2. Reconstruction of paleo-CO2 for the (A)
middle Paleocene to early Eocene and (B) middle
Miocene based on SI measurements from Ginkgo ( )
and Metasequoia ( ) fossil cuticles. Errors
represent 95 confidence intervals.
D. L. Royer et al., Science 292, 2310 -2313
(2001)
Published by AAAS
2
Figure 3. Estimates of paleo-CO2 concentration
derived from a variety of methods and their
corresponding model-determined temperature
departures ( T) of global mean surface
temperature (GMST) from present day for the (A)
middle Paleocene to early Eocene and (B) middle
Miocene. Paleo-GMST calculated from paleo-CO2
estimates using the CO2-temperature sensitivity
study of Kothavala et al. (32). Present-day
reference GMST calculated using the
pre-industrial CO2 value of 280 ppmv (14.7C).
The error range of GMST predicted from the
geochemical modeling-based CO2 predictions of (4)
corresponds to the model's sensitivity analysis.
D. L. Royer et al., Science 292, 2310 -2313
(2001)
Published by AAAS
3
PALEOCLIMATEEnhanced CO2 and Climate
Change Thomas J. Crowley and Robert A.
Berner, Science 4 May 2001Vol. 292. no. 5518,
pp. 870 - 872DOI 10.1126/science.1061664
4
(No Transcript)
5
(No Transcript)
6
Climate sensitivity constrained by CO
CO2 concentrations over the past 420 million
years Dana L. Royer, Robert A. Berner Jeffrey
Park, Nature, Vol 446 44629 March 2007 2007
doi10.1038/ nature05699
7
CO2 today
Milankovich cycles Eccentricity-100,000
Obliquity-41,000 Precession-23,000 years
100,000 y
23,000 y
41,000 y
8
(No Transcript)
9
(No Transcript)
10
(No Transcript)
11
Fig. 1. Midday vertical CO2 profiles measured at
12 global locations based on fits to samples
binned by altitude and averaged over different
seasonal intervals
B. B. Stephens et al., Science 316, 1732
-1735 (2007)
Published by AAAS
12
Fig. 3. Northern land and tropical land carbon
fluxes for the 1992 to 1996 time period estimated
by the 12 T3L2 models plotted as a function of
the models' post-inversion predicted mean
vertical CO2 gradients for the same seasonal
intervals as Fig
B. B. Stephens et al., Science 316, 1732
-1735 (2007)
Published by AAAS
Recommended
CrystalGraphics Presentations


