
Task 3: HAPs Emission Inventory - PowerPoint PPT Presentation
1 / 9
Title:
Task 3: HAPs Emission Inventory
Description:
Maricopa Association of Governments Ozone Precursors Inventory ... are important for toxics (e.g., lawn/garden, off-road diesel, charbroiling, etc. ... – PowerPoint PPT presentation
Number of Views:91
Avg rating:3.0/5.0
Title: Task 3: HAPs Emission Inventory
1
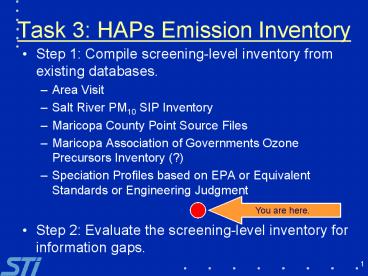
Task 3 HAPs Emission Inventory
- Step 1 Compile screening-level inventory from
existing databases. - Area Visit
- Salt River PM10 SIP Inventory
- Maricopa County Point Source Files
- Maricopa Association of Governments Ozone
Precursors Inventory (?) - Speciation Profiles based on EPA or Equivalent
Standards or Engineering Judgment - Step 2 Evaluate the screening-level inventory
for information gaps.
You are here.
2
Task 3 HAPs Emission Inventory
- Step 3 Address information gaps.
- Compile available information and estimate
emissions. - Prepare recommendations for further research.
3
Summary of PM10 Emissions
- Source Salt River PM10 Inventory
- Needed Revisions
- Estimate annual emissions for some source
categories (). - Address missing source categories that are
important for toxics (e.g., lawn/garden, off-road
diesel, charbroiling, etc.).
4
Summary of VOC Emissions
- Source Maricopa Countys records of major point
source emissions of VOCs - Additional information needs to be acquired or
developed, including gridded emissions for area,
non-road mobile, and on-road mobile sources.
5
Emissions Estimates for HAPs
6
Example Plot for Chromium
7
Example Plot for Chromium
- Map features
- Emissions for the southern half of the domain
will be addressed during the later stages of the
inventory development project, when we begin
addressing information gaps. - Point source emissions range up to 103 grams per
day. The most significant point source plotted
is National Gypsum Company. - Non-point source emissions range up to 6 grams
per day per grid cell. - Wind erosion from alluvial channels and disturbed
lands appears to be the largest non-point source.
However, it is important to note that the map
represents a windy day, or worst-case conditions
for this source.
8
Next Steps
- Identify and list source categories in need of
more attention. - Review aerial photography for expanded domain
(when it becomes available). - Use EPA Guidance to identify important sources of
Priority HAPs, highly toxic HAPs, and/or urban
HAPs. - Cross-reference lists of source types with
existing or anticipated emissions sources. - Identify and evaluate techniques to estimate and
spatially allocate emissions. - Recommend prioritization scheme.
9
Tentative Recommendations
- More detail and specific proposals will be
included with the interim memorandum. - Recommendations for significant sources
- Furniture finishing plant
- Review facility methods for estimating VOC
emissions. - Develop facility-specific VOC and HAPs profiles.
- On-road mobile sources
- Develop toxics inventory by applying MOBILE6 and
local inputs. (Much of this work is already
done.) - Fugitive dust
- Reprise earlier methods for the purpose of
estimating annual emissions rather than
day-specific emissions.
10
Tentative Recommendations
- Determine how best to address non-point sources
of ozone precursors. - Two options
- Acquire the MAGs model-ready inventory.
- Prepare a model-ready inventory from scratch.
- Address sources that are unlikely to be included
in screening-level inventories, but are likely to
be important sources of HAPs (e.g., lawn/garden,
off-road diesel, charbroiling, etc.). - Investigate potential sources of HAPs observed
through the air monitoring program.
Recommended
CrystalGraphics Presentations


