Assumptions on a Simple Linear Regression Model - PowerPoint PPT Presentation
1 / 12
Title:
Assumptions on a Simple Linear Regression Model
Description:
Constant variances: si2=s2. Error terms are independent distributed: ... Diagnostic Measure: Trendy Residual Plot. Detecting Lack of Fit with Residual Plots (2) ... – PowerPoint PPT presentation
Number of Views:596
Avg rating:3.0/5.0
Title: Assumptions on a Simple Linear Regression Model
1
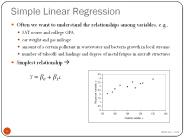
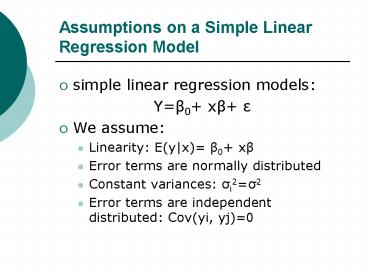
Assumptions on a Simple Linear Regression Model
- simple linear regression models
- Yß0 xß e
- We assume
- Linearity E(yx) ß0 xß
- Error terms are normally distributed
- Constant variances si2s2
- Error terms are independent distributed Cov(yi,
yj)0
2
Possible Violated Assumptions
- Lack of fit
- Nonlinear regression model of x
- Fail to include all the important covariates
- Non-constant variances of error terms
- Var(ei)si2? s2
- Non-normal Error terms
- Estimators of ßs are not normal
- Correlated error terms
- Cov(yi, yj)?0
3
Diagnostic Tools
- Residual Analysis detect the departure of the
assumptions - Residual Plots
- e VS yhat
- e VS x
- Probability-Probability Plot
- theoretical cumulative density VS observed
cumulative density - Durbin-Watson tests for correlations
4
Residual Plots
- Residual plot for a good model
- good all the assumptions are satisfied
- Pattern of Residual Plot spread-out randomly, no
pattern
5
Probability-Probability Plot (P-P Plot)
- X-axis observed cumulative density
- Y-axis theoretical cumulative density (Standard
Normal) - Pattern of p-p plot for a good model most of
the points stay on the 45o line.
45o line
6
Examining Residual Plots
- the overall pattern in the plot (ideally you
would like to see no pattern in the residuals) - the form and direction of any pattern if it
exists - deviations from the pattern (outliers and
influential observations)
7
Detecting Lack of Fit with Residual Plots (1)
- Violated Assumption Linearity
- Diagnostic Measure Trendy Residual Plot
8
Detecting Lack of Fit with Residual Plots (2)
- fail to include all the covariate.
- Diagnostic Measure clustered patterned
residual plot.
9
Detecting Non-constant Variances with Residual
Plots
- Violated Assumption non-constant variance of the
error term Var(ei)si2 - Diagnostic Measure Patterned Residual Plot
10
Checking the Normality Assumption
- Violated Assumption non-normal error term
- Diagnostic Measure in p-p plot, points are off
the 45o line.
45o line
11
Detect Residual Correlation The Durbin-Watson
Test
- Compute d using
- Strict way using the Durbin-Watson table run the
test. - A less strict way
- Compare d with 2.
- If d2, the residuals may not be correlated
- If d is far away from 2, the residuals may by
correlated
12
Detect Residual Correlation The Durbin-Watson
Test
- SPSS Output
Model Summary(b)
a Predictors (Constant), x b Dependent
Variable y1
Recommended
CrystalGraphics Presentations