
A Visualization Tool for fMRI Data Mining - PowerPoint PPT Presentation
1 / 1
Title:
A Visualization Tool for fMRI Data Mining
Description:
each cluster is mapped to a row and/or column in the table ... Front end for data mining / content-based data retrieval engine. Analyzed datasets ... – PowerPoint PPT presentation
Number of Views:61
Avg rating:3.0/5.0
Title: A Visualization Tool for fMRI Data Mining
1
A Visualization Tool for fMRI Data Mining
Nicu D. Cornea1, Dr. Ulukbek Ibraev1, Prof.
Deborah Silver1, Prof. Paul Kantor1, Prof. Ali
Shokoufandeh2, Jeff Abrahamson2, Prof. Sven
Dickinson31Rutgers University, 2Drexel
University, 3University of Toronto
fMRI
Functional Magnetic Resonance Imaging (fMRI) is
an increasingly popular imaging technique used to
understand brain functionality. Scans of the
subjects head are taken at regular intervals as
the subject performs some mental task resulting
in hundreds of 3D datasets. Large databases
containing thousands of fMRI scans are already
accessible to the research community the Brain
Image Database (BRAID), the fMRI Data Center
(fMRIDC), etc.
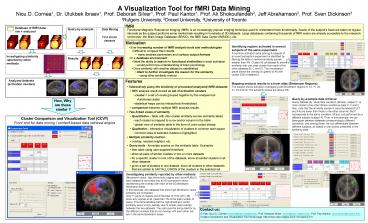
Motivation
Identifying regions activated in several subjects
of the same experiment. A common activation area
among 4 subjects of an event perception
experiment is identified by filtering the table
to remove similarity scores smaller than 4.
Cluster A8 (of dataset A) shows similarity with
one other cluster from each of the other datasets
(B, C and D). The visualization panel shows the
overlap (in green) of A8 with cluster D28 of
dataset D.
- Ever increasing number of fMRI analysis tools and
methodologies - Difficult to compare their results
- many analysis parameters and various output
formats - In a database environment
- Want the ability to search for functional
similarities in brain activation - would permit new understanding of brain
psychology - Once similarity with another dataset is
established - Want to further investigate the reason for the
similarity - using other similarity metrics
Mapping analysis results to a brain atlas
(Brodmann Regions) The subject shows activation
overlapping with Brodmann regions 9, 10, 11, 20,
21, 23 and 39. The similarity scores are above 5.
Query-by-example data retrieval Query dataset
(A) study face condition (SFace), subject 7, is
more similar to the other SFace conditions (sets
D, F and I). Also, note that the similarity
scores in columns labeled F (F1 and F4) are lower
than those in the other columns. Set F
corresponds to the same condition, SFace, but
performed by a different subject (subject 4).
Thus, in this example, we can distinguish between
datasets corresponding to different conditions,
and among those, we can differentiate between
different subjects, all based on the scores
presented in the similarity table.
How, Why are these similar ?
Cluster Comparison and Visualization Tool
(CCVT) Front end for data mining / content-based
data retrieval engine
Investigating similarity reported by other
methods (Brodmann vector http//www.scils.rutgers
.edu/brim/PUBLIC) each dataset is converted into
an 82-component vector representing the overlap
with each of the 82 lateralized Brodmann
areas. In this example, two datasets that show
high Brodmann vector similarity are compared.
Only 11 pairs of clusters out of the total of
1150 (25 x 46) show any overlap at all (less
than 1 of the total number of pairs). This
demonstrates that the high Brodmann vector
similarity score is only partially due to actual
voxel overlap between the two datasets. The rest
could be accounted for by the different clusters
that do not overlap with each other but are in
the same Brodmann areas.
Contact us
E-mail Nicu D. Cornea cornea_at_caip.rutgers.edu,
Prof. Deborah Silver silver_at_caip.rutgers.edu,
Prof. Paul Kantor paul.kantor_at_rutgers.edu
Cluster Comparison and Visualization Tool home
page http//www.caip.rutgers.edu/cornea/CCVT/
Recommended
CrystalGraphics Presentations


