
Data Mining and Access Pattern Discovery - PowerPoint PPT Presentation
Title:
Data Mining and Access Pattern Discovery
Description:
For illustration chart assumes 10-12 sec. calculation time per ... Perform cluster analysis in a distributed fashion. with reasonable data transfer overheads ... – PowerPoint PPT presentation
Number of Views:112
Avg rating:3.0/5.0
Title: Data Mining and Access Pattern Discovery
1
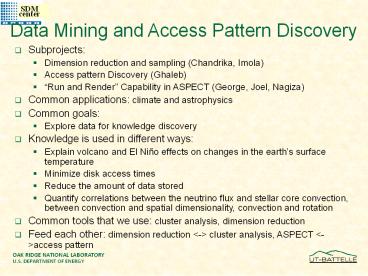
Data Mining and Access Pattern Discovery
- Subprojects
- Dimension reduction and sampling (Chandrika,
Imola) - Access pattern Discovery (Ghaleb)
- Run and Render Capability in ASPECT (George,
Joel, Nagiza) - Common applications climate and astrophysics
- Common goals
- Explore data for knowledge discovery
- Knowledge is used in different ways
- Explain volcano and El Niño effects on changes in
the earths surface temperature - Minimize disk access times
- Reduce the amount of data stored
- Quantify correlations between the neutrino flux
and stellar core convection, between convection
and spatial dimensionality, convection and
rotation - Common tools that we use cluster analysis,
dimension reduction - Feed each other dimension reduction lt-gt cluster
analysis, ASPECT lt-gtaccess pattern
2
ASPECT Adaptable Simulation Product
Exploration and Control Toolkit
Nagiza Samatova, George Ostrouchov, Faisal
AbduKhzam, Joel Reed,Tom Potok Randy
Burris Computer Science and Mathematics
Division http//www.csm.ornl.gov/
SciDAC SDM ISIC All-Hands Meeting March 26-27,
2002 Gatlinburg, TN
3
Team Collaborators
Team
- AbduKhzam, Faisal distributed streamline data
mining research - Ostrouchov, George Application coordination,
sampling data reduction, data analysis - Reed, Joel ASPECTs GUI Interface, Agents
- Samatova, Nagiza Management, streamline
distributed data mining algorithms in ASPECT,
application tie-ins - Summer students - Java-R back-end interface
development
Collaborators
- Burris, Randy Establishing prototyping
environment in Probe - Drake, John A lot of ideas have been inspired
from - Geist, Al Distributed and streamline data
analysis research - Mezzacappa, Tony TSI Application Driver
- Million, Dan Establishing software
environments in Probe - Potok, Tom ORMAC Agent Framework
4
Analysis Visualization of Simulation Product
State of the Art
- Post-processing data analysis tools (like
PCMDI) - Scientists must wait for the simulation
completion - Can use lots of CPU cycles on long-running
simulations - Can use up to 50 more storage and require
unnecessary data transfer for data-intensive
simulations
- Simulation monitoring tools
- Need simulation code instrumentation (e.g., call
to vis. libraries) - Interference with simulation run snapshot of
data gt can pause simulation - Computationally intensive data analysis task
becomes part of simulation - Synchronous view of data and simulation run
- More control over simulation
5
Improvements through ASPECTData stream ? not
simulation ? monitoring tool
- ASPECTs advantages
- No simulation code instrumentation
- Single data multiple views of data
- No interference w/ simulation
6
Run and Render Simulation Cycle in SciDAC Our
vision
7
Approaching the Goal through a Collaborative Set
of Activities
8
Building a Workflow Environment
9
80 gt 20 Paradigm in Probes Research
Application driven Environment
From frustrations
To smooth operation
- Very limited resources
- General purpose software only
- Lack of interface with HPSS
- Homogenous platform (e.g., Linux only)
- Hardware Infrastructure
- RS6000 S80, 6 processors
- 2 GB memory,1 TB IDE FibreChannel RAID
- 360 GB Sun RAID
- Software Infrastructure
- Compilers (Fortran, C, Java)
- Data Analysis (R, Java-R, Ggobi)
- Visualization (ncview, GrADS)
- Data Formats (netCDF, HDF)
- Data Storage Transfer (HPSS, hsi, pftp,
GridFTP, MPI-IO)
10
ASPECT Design and Implementation
11
ASPECT Front-End Infrastructure
- Functionality
- Instantiate Modules
- Link Modules
- Control Valid Links
- Synchronously Control
- Add Modules by XML
12
ASPECT Implementation
- Front-end interface
- Java
- Back-end data analysis
- R (GNU S-Plus) (and C) provides richness of data
analysis capabilities - Omegahats Java-R interface (http//omegahat.org)
- Networking layer
- ORNLs ORMAC Agent Architecture based on RMI
- Other Servlets, HORB (http//horb.a02.aist.go.jp/
horb/), CORBA - File Readers
- NetCDF
- ASCI
- HDF5 (later)
13
Agents for Distributed Data Processing
14
Agents and Parallel ComputingAstrophysics
Example
- Massive datasets
- Team of agents divide up the task
- Each agent contributes solution for his portion
the dataset - Agent-derived partial solutions are merged to
create total solution - Solution appropriately formatted for resource
15
Team of Agents Divide Up Data
1)Resource Aware Agent Receives Request
Varying Resources
16
Team of Agents Divide Up Data
1)Resource Aware Agent Receives Request
2) Announces Request to Agent Team
Varying Resources
17
Team of Agents Divide Up Data
1)Resource Aware Agent Receives Request
2) Announces Request to Agent Team
Varying Resources
3) Team Responds
18
Team of Agents Divide Up Data
1)Resource Aware Agent Receives Request
2) Announces Request to Agent Team
Varying Resources
3) Team Responds
- 4) Resource Aware Agent
- Assembles and formats for resource
- Hands back solution
19
Distributed and Streamline Data Analysis Research
20
Complexity of Scientific Data Sets Drives
Algorithmic Breakthroughs
TeraPetabytes Existing methods do not scale in
terms of time and storage
Challenge Develop effective efficient methods
for mining scientific data sets
Distributed Existing methods work on single
centralized dataset. Data transfer is prohibitive
High-dimensional Existing methods do not scale up
with the number of dimensions
Dynamic Existing methods work w/ static data.
Changes lead to complete re-computation
21
Need to break the Algorithmic Complexity
Bottleneck
- Algorithmic Complexity
- Calculate means O(n)
- Calculate FFT O(n log(n))
- Calculate SVD O(r c)
- Clustering algorithms O(n2)
For illustration chart assumes 10-12 sec.
calculation time per data point
22
RACHET High Performance Framework for
Distributed Cluster Analysis
23
Paradigm Shift in Data Analysis
Distributed Approach
Parallel Approach
- Data distribution is driven by a science
application - Software code is sent to the data
- One time communication
- No assumptions on hardware architecture
- Provide an approximate solution
- Data distribution is driven by algorithm
performance - Data is partitioned by a software code
- Excessive data transfers
- Hardware architecture-centric
- Aim for the exact computation
(RACHET approach)
24
Distributed Cluster Analysis
RACHET merges local dendrograms to determine
global cluster structure of the data
Intelligent agents
N data size S number of sites k number of
dimensions
25
Distributed Streamline Data ReductionMerging
Information Rather Than Raw Data
- Global Principal Components
- transmit information, not data
- Dynamic Principal Components
- no need to keep all data
Method Merge few local PCs and local means
- Benefits
- Little loss of information
- Much lower transmission costs
26
DFastMap Fast Dimension Reduction for
Distributed and Streamline Data
- Features
- Linear time for each chunk
- One time communication for distributed version
- 5 deviation from monolithic version
27
Application Data Reduction and Potentials for
Scientific Discovery
28
Adaptive PCA-based Data Compression in Supernova
Explosion Simulation
- Compression Features
- Adaptive
- Rate 200 to 20 times
- PCA-based
- 3 times better than subsampling
Loss function Mean Square Error
(MSE) Sub-sampling 1 point out of 9 (black) PCA
approximation k PCs out of 400 (red)
29
Data Compression Discovery of the Unusual by
Fitting Local Models
- Strategy
- Segment series
- Model the usual to find the unusual
- Key ideas
- Fit simple local models to segments
- Use parameters for global analysis and monitoring
- Resulting system
- Detects specific events (targeted or unusual)
- Provides a global description of one or several
data series - Provides data reduction to parameters of local
model
30
From Local Models to Annotated Time Series
Segment series (100 obs)
Fit simple local model ( c0, c1, c2, e?,
e2)
Select extreme (10)
Cluster extreme (4)
Map back to series
31
Decomposition and Monitoring of a GCM Run
32
Publications Presentations
Publications
- F. AbuKhzam, N. F. Samatova, and G. Ostrouchov
(2002). FastMap for Distributed Data Fast
Dimension Reduction, in preparation. - Y. Qu, G. Ostrouchov, N.F. Samatova, A. Geist
(2002). Principal Component Analysis for
Dimension Reduction in Massive Distributed Data
Sets, in Proc. The Second SIAM International
Conference on Data Mining, April 2002. - N.F. Samatova, G. Ostrouchov, A. Geist, A.
Melechko. RACHET An Efficient Cover-Based
Merging of Clustering Hierarchies from
Distributed Datasets, Special Issue on Parallel
and Distributed Data Mining, International
Journal of Distributed and Parallel Databases An
International Journal, 2002, Volume 11, No. 2,
March 2002. - N. Samatova, A. Geist, G. Ostrouchov, RACHET
Petascale Distributed Data Analysis Suite, in
Proc. SPEEDUP Workshop on Distributed
Supercomputing Data Intensive Computing, March
4-6, 2002, Badehotel Bristol, Leukerbad, Valais,
Switzerland.
Presentations
- N. Samatova, A. Geist, G. Ostrouchov, RACHET
Petascale Distributed Data Analysis Suite,
SPEEDUP Workshop on Distributed Supercomputing
Data Intensive Computing, March 4-6, 2002,
Badehotel Bristol, Leukerbad, Valais, Switzerland - A. Shoshani, R. Burris, T. Potok, N. Samatova,
SDM-ISIC, TSI All-Hands Meeting, February, 2002.
33
Thank You!
Recommended
CrystalGraphics Presentations


