
An Academic Overview of Desegregation - PowerPoint PPT Presentation
1 / 51
Title:
An Academic Overview of Desegregation
Description:
More frequent student involvement in cultural awareness workshops and ethnic studies courses ... real equal opportunities to fashion and participate in the ... – PowerPoint PPT presentation
Number of Views:94
Avg rating:3.0/5.0
Title: An Academic Overview of Desegregation
1
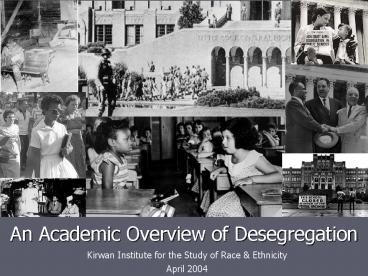
An Academic Overview of Desegregation
Kirwan Institute for the Study of Race
Ethnicity April 2004
2
Desegregation The Promise of Brown and Challenge
of Grutter
- 50 years ago Brown offered a promise of
desegregation last year Grutter challenged us to
achieve it in another 25. - This presentation will address
- How far weve come since Brown, comparing
benchmarks of social and economic health - An overview of research supporting integration,
diversity, and the long-term learning and social
outcomes of desegregation. - Browns failures and considerations in moving
forward.
3
How Far We Have Come and the Gaps We Have Yet to
Close
A Comparison of Social and Economic Health
Measures from 1954 to 2004.
4
Benchmarks of Social/Economic Health
- Education
- Housing
- Poverty
- Employment
- Income
- Crime
- Health
- Other contemporary concerns
Note Not all data for this presentation match
perfectly with the Brown decision in 1954, due
to data availability and comparability problems
some data from later than 1954 were used
5
Education Educational Attainment
6
Educational Attainment
- Educational attainment for African Americans has
increased considerably since 1950. - The proportion of the population with a high
school degree increased by 300 during this time,
the proportion of the population with a 4-year
college degree increased by almost 500. - Disparity between African American and white
educational attainment has declined but is still
prevalent.
Source U.S. Department of Commerce, Bureau of
the Census, U.S. Census of Population, 1960, Vol.
1, part 1 Current Population Reports, Series
P-20 and unpublished data and 1960 Census
Monograph, Education of the American
Population, by John K. Folger and Charles B.
Nam. From U.S. Dept. of Education, National
Center for Education Statistics, Digest of
Education Statistics 2002
7
Education High School Dropout Rate
8
Education College Entrance Rate
9
Education H.S. Dropout and College Enrollment
Rates
- High School dropout rates for African Americans
have decreased substantially in the last thirty
years, dropping from 33.5 in 1974 to 17 in
2002. - H.S. dropout rates still remain 50 higher than
the white dropout rate in 2002 of 11. - College enrollment rates have increased from 36
in 1960 to 57.7 in 2002 for African Americans
(an increase of 66). - College enrollment rates for Whites increased by
45 during this forty-four year time period.
Note Data from 1960 for all non-white races, no
individual African American data collected
Source U.S. Bureau of Labor Statistics and Post
Secondary Education Opportunity at
http//www.postsecondary.org
10
Housing Home Ownership
11
Home Ownership
- The proportion of African Americans renting has
decreased by 17 since 1950, but the proportion
of Whites renting has decreased by 33 during
this same time period. - In 2000, the proportion of African American
households that had obtained home ownership was
65 lower than the proportion of white households
that had obtained homeownership.
Source U.S. Census Bureau, 2000 Census and
Statistical Abstract 1955
Note Data from 1950 for all non-white races, no
individual African American data collected
12
Poverty Poverty Rates
13
Poverty Child Poverty by Race
Child Poverty 1955 to 1995 Source Changing
America Indicators of Social and Economic
Well-Being by Race and Hispanic Origin (1997), By
the Council of Economic Advisors for President
Clinton
14
Poverty Trends
- African American poverty rates have declined by
approximately 60 since 1959, white poverty rates
declined by approximately 50 during this time. - Disparity persists African American individual
and family poverty rates are currently twice the
rate of Whites. - The number of African American children in
poverty have declined substantially since 1960. - Disparity persists African American child
poverty rates were approximately double the rate
of white child poverty in the 1990s.
15
Employment Unemployment by Race
Unemployment by Race 1950 to 1997 Source
Changing America Indicators of Social and
Economic Well-Being by Race and Hispanic Origin
(1997), By the Council of Economic Advisors for
President Clinton
16
Employment Disparity
- Unemployment rates have varied considerably over
time as the U.S. Economy has cycled. - Generally African American unemployment has been
approximately twice as high as white unemployment
throughout this time. - In 2003, unemployment disparity remains for
African Americans and Hispanics. - The African American unemployment rate was 11.6
for men in 2003, and 10.2 for women. - These figures are double the unemployment rates
for white men (5.6) and women (4.8) in 2003.
Sources Changing America Indicators of Social
and Economic Well-Being by Race and Hispanic
Origin (1997), By the Council of Economic
Advisors for President Clinton and current data
from the Bureau of Labor Statistics
17
Income Personal Income Growth (2001 s)
18
Income Family Income Growth (2001 s)
19
Income Growth
- Incomes have more than doubled for African
American men, women and families since the
1950s. - Disparity in income has actually grown since
1954, the median African American family income
in 1954 was 55 of the white median, in 2002 this
figure had grown to 62. - Although income disparity has closed, a
tremendous disparity in net assets between
African Americans and Whites is evident in recent
Census Data. - In 2000, the median assets (7,500) for African
American households was 9.5 of the median assets
for non-Hispanic whites (79,000).
Source U.S. Census Bureau, Statistical Abstract
and Net Worth Report
20
Health Age Adjusted Mortality Rate
21
Health Life Expectancy by Race
Life Expectancy by Race 1930 to 1995 Source
Changing America Indicators of Social and
Economic Well-Being by Race and Hispanic Origin
(1997), By the Council of Economic Advisors for
President Clinton
22
Health
- Mortality rates have declined for both African
Americans and Whites since 1954. - Disparity persists In 2002, mortality rates for
African American men were 27 higher than
mortality rates for white men, mortality rates
are 14 higher for African American women than
White women. - Average life expectancy for African American men
and women have increased since 1950, but still
remain lower than the white mortality rates.
Note Data from 1954 for mortality all non-white
races, no individual African American data
collected
Sources Changing America Indicators of Social
and Economic Well-Being by Race and Hispanic
Origin (1997), By the Council of Economic
Advisors for President Clinton and mortality data
from the U.S. Census Bureau statistical abstract
23
Crime Homicide Victimization Rate
24
Crime Prison Admissions by Race
Prisons Admissions by Race 1930 to 1995 Source
Changing America Indicators of Social and
Economic Well-Being by Race and Hispanic Origin
(1997), By the Council of Economic Advisors for
President Clinton
25
Crime
- Victimization rates for homicide have declined
27 for African Americans but are still 7 times
the rate of white homicide victimization. - The number of incarcerated African Americans has
increased 800 since the 1950s, the number of
incarcerated African Americans surpassed the
number of Whites incarcerated in the late 1980s.
Sources Changing America Indicators of Social
and Economic Well-Being by Race and Hispanic
Origin (1997), By the Council of Economic
Advisors for President Clinton and current data
from the Bureau of Justice Statistics
26
Other Contemporary Trends
- Persistent Residential Segregation
- Residential segregation has decreased slightly in
all metropolitan areas, but a high degree of
segregation still exists in most metropolitan
areas (particularly in the Northeast and Midwest) - Source Lewis Mumford Center (2004)
- School District Segregation
- Research has shown increasing levels of
segregation for Americas school districts, which
is manifested at the regional level - Source Harvard Civil Rights Project A
Multiracial Society with Segregated Schools Are
We Losing the Dream? (2003) - People of Color Living in Concentrated Poverty
- In 2000, more than 2/3s of people living in
concentrated urban poverty were African American
or Hispanic - In 1999, half of poor rural African Americans and
Native Americans are found in concentrated
poverty rural areas, 1/3 of all poor rural
Hispanics are found in areas of high poverty.
Source USDA, Economic Research Services,
Brookings Institute
27
School Segregation Today Segregation and Student
Poverty
28
School Segregation Today Segregation and Student
Performance
29
School Segregation Today
- Urban sprawl and regional government
fragmentation have worked to re-segregate urban
school districts. - What is the link between todays segregated urban
schools and student poverty or student
performance?
Sources Dissimilarity Index Data from Lewis
Mumford Center, School District Data from
National Center for Education Statistics
30
Summary
- Data suggest improvements since 1954 vary based
on the indicator, education and poverty has
improved but economic and crime indicators have
not improved as much. - Despite improvements across multiple indicators,
significant racial disparities in education,
poverty, economic health, income, health, crime
still exist.
31
Segregation and Its Effects
32
What is Segregation?
- What is segregation?
- In regard to schools, segregation pertains to
situations in which a disproportionate number of
white students or students of color attend a
school or school system. - Segregation can also be defined from emotional,
psychological, mental, physical, legal and social
perspectives. - de jure legally imposed segregation
- de facto segregation (especially in schools)
that happens in fact although not required by
law.
33
What is Segregation?
- Dr. Martin Luther King Jr. in a 1956 speech given
to the National Committee for Rural Schools noted
that segregation inevitably makes for inequality
and ends up depersonalizing the segregated. - He further defined segregation as a twin evil
that gives a sense of inferiority to Blacks, and
a sense of superiority to Whites, which in turn
creates a distorted psychological self that
distorts democracy.
34
What is Desegregation?
- Desegregation refers to efforts at remedying
racial imbalances. It traditionally means
removing formal legal barriers, or simply placing
students of different races in proximity to each
other. Efforts are often limited to moving and
mixing racial populations to end racial
isolation. As it has played out in most of
Americas educational settings, desegregation
requires students of the non-dominant group (most
often non-white) to assimilate into the school
and culture created for and controlled by the
dominant group (most often white). Structures
are not altered to meet the needs of the new and
different students.
Ware, L. and M. Ware 1996. Plessys Legacy
Desegregating the Eurocentric Curriculum.
Georgia State University Law Review 12.
35
What is Integration?
- Integration is inclusive, placing value on the
historical, intellectual, and cultural
contributions of all groups. - Integration is creative, and is therefore more
profound and far-reaching than desegregation.
Integration is the positive acceptance of
desegregation and the welcomed participation of
Negroes in the total range of human activities.
Integration is genuine intergroup, interpersonal
doing. Desegregation then, rightly is only a
short-range goal. Integration is the ultimate
goal of our national community.
Quote by Dr. Martin Luther King from The Ethical
Demands for Integration.
36
Factors in Education which Shape Student
Experiences and Impact Student Outcomes
Source Gurin, P. (1999). The Compelling Need
For Diversity In Higher Education.
37
Student Background Characteristics School
Segregation K-12
- Nearly every American child under the age of
sixteen attends school, spending most of their
days over nearly three quarters of the year in
the classroom.
- American public schools are now only 60 white
nationwide and nearly one fourth of U.S. students
are in states with a majority of non-white
students. - The vast majority of white primary and secondary
school students have no significant contact with
black, Hispanic, or American Indian students in
the classroom. - The vast majority of African American primary and
secondary school students have no significant
contact with white students on a daily basis.
Source The Harvard Civil Rights Project. Brown
at 50 Kings Dream or Plessys Nightmare?
38
Student Background Characteristics School
Segregation in Cleveland PMSA
Exposure Index Isolation Indices
Source Lewis Mumford Center
39
Structural Diversity Institutional
Characteristics
- Teacher Diversity
- There is a need to recruit and hire teachers that
reflect the diversity of the student body
teachers attitudes and behavior is of great
importance in order to foster positive
interracial contact.
- Research has shown the tendency of teachers to
perceive the academic potential of black and
white students differently.1 - Teachers of color are less likely to expel and
suspend students of color, and less likely to
assign them to lower track and special education
courses.2 - Salinas (2002) suggests the extremely low
percentage of minority teachers in public schools
has led to a high dropout rate among minority
students. 3 - Racially and ethnically diverse educators serve
as role models, encourage students to perform
better, better understand cultural differences,
and break down the students' stereotypes.3
- Ferguson, R. F. (1998). Teachers' perceptions
and expectations and the black-white test score
gap. - Denn, Rebekah. (2002) Black Teachers are Hard to
Find. Seattle Post-Intelligencer - Salinas, J.P. (2002) The Effectiveness of
Minority Teachers on Minority Student Success.
40
Structural Diversity Institutional
Characteristics
- Teacher Diversity K-12
- In 2001 African American teachers represented 7
of the public school teaching force, whereas
African American students represented 17.1 of
the public school student population.1
- In 1990, more than 70 of all teachers were
middle-aged, white, and female.2 - 85 of the students currently enrolled in
undergraduate teacher education programs are
white females.3 - The pool of potential teachers of color narrows
at every step along the educational ladder.
Traditionally, students of color are less likely
to graduate from high school, less likely still
to go on to college, then less likely to
graduate, and less likelier still to take and to
pass standardized entrance or exit teaching exams.
41
Structural Diversity Faculty in Higher Education
Full-time instructional faculty in
degree-granting institutions, all ranks 2000
Source National Center for Education Statistics
42
Diversity Experiences in Education Classroom
Diversity
- Despite and increasingly racially diverse public
school K-12 enrollment, white students are
experiencing more isolation from black and Latino
students
- In higher education, there has been relatively
little change regarding the racial makeup of
students over the last five years. White,
non-Hispanics still constitute nearly seventy
percent of the student body. - From 1999 to 2002, Black undergraduate enrollment
has increased a mere .7, or an increase of
280,000 students in four years. In contrast,
white undergraduate enrollment has increased by
1,843,000 students in the last four years. - Racial diversity has a direct positive impact on
the individual white student The more diverse
the student body, the greater the likelihood that
the white student will socialize with someone of
a different racial group or discuss racial
issues.
Source Harvard Civil Rights Project. Race in
American Public Schools US Census Bureau
43
Diversity Experiences in Education Classroom
Diversity
- Having a diverse student body and serious
engagement of issues of diversity in the
curriculum and classroom is associated with
- A positive impact on attitudes toward racial
issues - Stronger commitment to multiculturalism and
promoting racial understanding - Opportunities to interact in deeper ways with
those who are different - More frequent student involvement in cultural
awareness workshops and ethnic studies courses - A positive impact on cognitive development and
academic growth - Increased academic achievement, as measured by
test scores - A greater faculty emphasis on racial and gender
issues in their research and in the classroom - Greater overall satisfaction and involvement with
the institution. - What is of special interest here is that these
same environmental characteristics have also been
shown to have positive impacts on student
retention, overall college satisfaction, college
GPA, intellectual self-confidence, and social
self-confidence.
Chang, M.J. (1996), Who benefits from diversity
in higher education?
44
Campus Diversity Experiences Classroom Diversity
National College Enrollment by Race (Of Those Age
3 Years Old and Over)
Source US Census Bureau
45
Student Outcomes Learning Outcomes
A racially and ethnically diverse university
student body has far-ranging and significant
benefits for all students, non-minorities and
minorities alike." -Patricia Gurin, The
Compelling Need for Diversity in Higher
Education
- Segregated schools that are predominantly
non-white often transmit lower expectations for
students and offer a narrow range of occupational
and educational options. - Desegregated schooling has a positive effect on
the number of years of school completed and on
the probability of attending college. - Hallinan and Williams (1990) found that both
black and white students who had cross-race
friendships had higher educational aspirations
than those with same-race friendships.1 - Mickelson (1997) found that the more students
(both black and white) that were exposed to
desegregated education, the better were their
academic achievements (as measured by
standardized tests), and the higher their
secondary track placements.2 - Students learn more and think in deeper, more
complex ways in a diverse educational
environment.
1. Hallinan, M. T. Williams, R. (1990).
Student characteristics and the peer influence
process A nationwide study.
2. Mickelson, Roslyn. (2003). The Academic
Consequences Of Desegregation And Segregation.
46
Student Outcomes Societal Outcomes
- Grutter went beyond Brown in finding successful
integration a necessity for the American economic
system and even national security.
- If African-American and Latino workers were
represented at colleges and universities in the
same proportions as their share of 18- to 24-year
olds, U.S. wealth would increase by 231 billion
every year, annual tax revenues would increase by
80 billion, and the proportion of minority
families with inadequate incomes would decrease.1 - One study found that 56 of blacks who graduated
from institutions studied went on to earn
advanced degrees, including law, medicine, and
business.2 - Students who attend more diverse schools have
higher comfort levels with members of racial
groups different than their own, an increased
sense of civic engagement and a greater desire to
live and work in multiracial settings relative to
their more segregated peers.
1. Carnevale, A.P. (1999). Paper presented at
ACE's Symposium and Working Research Meeting on
Diversity and Affirmative Action 2. Bok, D.
Bowen, D. (1998). The Shape of the River
long-term consequences of considering race in
college and university admissions.
47
Student Outcomes Democracy Outcomes
- We are not just trying to make better schools for
poor non-whites, we are trying to make citizens
for a better nation by providing all students
with a truly integrated experience.
- Education is perhaps the most important crucible
for remedying disparities, enhancing life
opportunities, and promoting a genuine
multiracial and multi-ethnic democracy. - A more inclusive educational system creates a
more inclusive society-a society in which all
individuals and groups have real equal
opportunities to fashion and participate in the
democratic process.
48
Learning from the Past to Build a More Equitable
Future
49
Where Brown has failed
- Our schools today are more equitable than before
Brown, however they are currently resegregating
at alarming rates, both racially and
economically. - Although the demographics have changed
dramatically in many schools, few have made
fundamental changes in organization and programs
to address the differing needs of incoming
student populations. - Keeping institutions such as education intact,
and attempting to include those who were
previously excluded requires that those who are
coming in conform. This suggests we are
numerically rather than culturally off. - It is not enough to increase our efforts in
directions that have shown little success in the
past, instead we need transformative thinking.
50
Looking Forward
- Our focus should be outcome-oriented, not just
simple process or input focused. We must identify
our goals, then align our institutional
arrangements to produce those desired outcomes. - Working towards true integration, requires giving
those who have been historically excluded, a
voice to help reform and shape a new institution.
- We must engage the larger debate, broaden our
goals, challenge the exclusivity of current
arrangements, and strive towards greater equity
in our institutional structures.
51
Kirwan Institute For The Study of Race and
Ethnicity
www.KirwanInstitute.org
Recommended
CrystalGraphics Presentations


